
Earlier we talked about mining patterns from data repositories. In this article, you will learn about kind of patterns in data mining. The pattern mining are tasks performed by the data mining engine. Later the patterns can be evaluated based on the interestingness measures.
Mining Tasks
The data mining tasks are classified into two categories – descriptive and predictive.
| Descriptive Mining Tasks | This describes the general character or properties of data. |
| Predictive Mining Tasks | These tasks perform inference on data to make future predictions. |

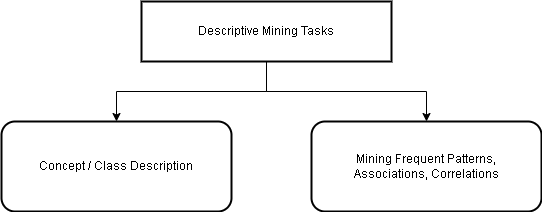
Concept / Class Description
The concept or class description deals with the task of characterization and description of data. Data can be associated with classes or concepts. For example,
Classes of items for sale include computers and printers
Customer concept include big spender and budget spender which purchasing items.
The classes must be described in clear and concise terms which is known as ” class / concept description “.
How To Find Such Descriptions?
There are three ways to find class / concept description.
Data Characterization – This is summarizing the data of target class based on features.
Data Discrimination – This compares the target class with one or more comparative classes called the contrasting classes.
The third option is to use both data characterization and data discrimination.
What Are The Methods Of Data Characterization ?
There are simple methods to characterize the data. One is simple summaries based on statistical measures. Second is the roll-up operation on OLAP data cube that also summarizes the data. The third method is to use the attribute oriented induction technique.
The output of characterization can be presented in various forms. For example, Pie Charts, Bar Charts, Curves, Multi-dimensional data cubes and multi-dimensional tables.
The resulting descriptions can also be presented as generalized relations or in rule form called characteristic rules.
Data Characterization Example
Q1. Produce a description of summarizing the characteristics of customer whole spend Rs 3000 in last 6 months.
The result could be a general profile of customers such as 40-50 year old, employed, credit rating and other features.
Data Discrimination Example
Q2. Compare features of software products whose sales up by 10 % in last year with software product whose sales went down by 30%.
The resultant description is same as that of data characterization, however, we also have comparative measures that distinguish the target class and contrasting class.
Mining Frequent Patterns, Associations, and Correlations
The frequent patterns are those patterns that occur frequently in data. The frequent pattern includes frequent item sets, sub-sequences, and sub-structures.
Frequent Item-set
Those items that frequently appear together in a transactional data set is called frequent item-set.
Frequent Sub-sequence
The customer buying first PC, then camera, then a memory card is an example of sub-sequence.
Frequent Sub-structure
The sub-structure means different structural forms such as graphs, trees, and lattices, that are combined with item-sets and/or sub-sequences.
Association Analysis
Association analysis identify relationship between items that are bought together during transactions. Consider the following example.
Example: A store want to known which is purchased together. So they created rules such as

buys(X, "computer") => buys(X, accessories") [support = 1%, confidence = 50%]

where X is the customer, the confidence or certainty is 50% means if X buys computer, there is 50% chance that he will buy computer accessories.

Support means of all transaction % is where computer and computer accessories bought together.Consider another rule like above.
age(X, "20 ... 29") And income(X, "20K ... 29K") => buys (X, "CD Player") [support = 2%, confidence = 60%]The second rule is example of multi-dimensional rule where more than two attributes – age and income are involved.
Therefore, frequent item-set mining is the simplest form of frequent pattern mining.

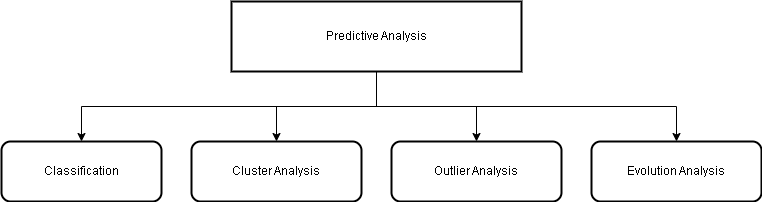
Classification
There are many predictive analysis techniques which extract information from the data to make predictions about future results. Classification is the process of finding a model or function that
- describe and distinguishes data classes or concepts
- for using the model to predict the class of objects
- whose class label is unknown.
In short, use the existing data of classes or concepts and create a model that predict for object of unknown classes.
This model analyze training data ( data of known classes) to build the predictive model.
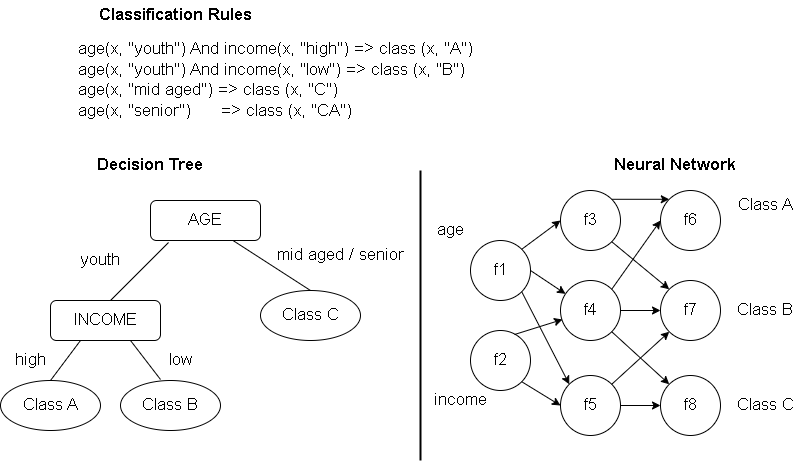
How This Model Presented ?
There are three different ways to present this model.
- classification rules
- decision trees
- mathematical formulae or neural networks
The neural network is collection of neurons like processing units with weighted connections between the units.
The classification algorithms find relationships and predicts categorical (discrete, unordered) labels for classes. However, if the prediction model is continuous-valued functions. If does numerical predictions and give numerical values, not class labels.
A regression analysis is done in such cases.
Examples:
Q. To classify a large set of items in the store, based on 3 kinds of responses to a sales campaign : good, mild, and no response.
So, we can target these three classes and make a model for these classes based on the features of the items, such as price, brand, place made, type and category. These features are predictors and the data is used for classification in future.

Cluster Analysis
The cluster analyze data without consulting a known class label. The objects are clustered based on principle of maximizing the inter-class similarity and minimizing the inter-class similarity.
Objects are similar in one cluster, but dissimilar to objects in other cluster.
Outlier Analysis
Data objects that do no comply with the general behavior or model of the data. These data are outliers.
Most mining methods discard outliers as noise or exceptions.
Mining of outliers known as outlier mining. Sometimes useful in fraud detection to people who are interested in rare events.
Some examples are – extremely large purchase, fraudulent usage of credit cards, etc.
Evolution Analysis
The data evolution analysis describes and models regularities or trends for objects whose behavior changes over time.
Example:- correlation, clustering of time-series data.
We have seen patterns types, but patterns are interesting only is they are useful, easily understood by humans, novel in nature, and valid on new or old test data with some certainty.
Some interesting patterns are based on subjective measures such as user belief. The patterns thus discovered must lead to some action or confirm some hypothesis. Therefore, you keep in mind that all minded patterns are not interesting.
