The bar charts used to display statistical data. It is a graphical method to present data and each bar has two dimensions. Usually, one dimension is time. In this article, you will learn to draw a bar chart with the help of C programming graphics support.
Problem Definition
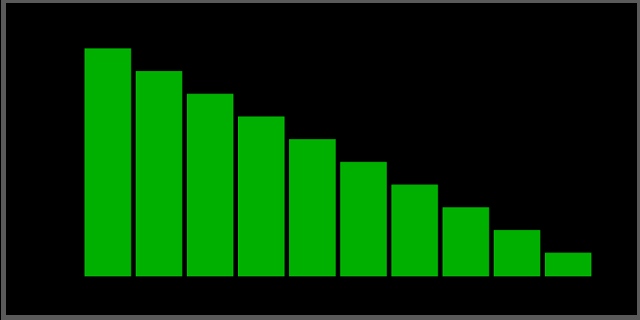
We want to demonstrate the ability of C graphic support to draw bar that can represent data. The bar chart in this example program does not contain any data. However, we might add data in similar examples in future articles.
To draw the graph, the program goes through the following steps:
- Declare all graphics variables.
- Initialize all variables.
- Initialization of the graph and set the path to the BGI interface.
- Set the fill style for the bars.
- Draw the bar chart.
- Close the graph.
Program Code – Bar Chart
/* Program to create bar chart in C */
#include <stdio.h>
#include <graphics.h>
#include <stdlib.h>
#include <conio.h>

int main()
{
/* Variable declaration */

int gdriver, gmode,i,j;
int x_start, y_start, x_end, y_end;

/* variable initialization */

gdriver = DETECT;

/* Graph initialization */

initgraph(&gdriver, &gmode, "d:\\turboc3\\bgi");

/* Loop through the fill style */

x_start = 100;
y_start = 120;
x_end = 140;
y_end = 340;


/* Set fill style */

setfillstyle(SOLID_FILL, GREEN);

/* draw the bar chart */


i = 0;
j = 5;

while(i < 10)
{
x_start = x_start + 40 + j;
x_end = x_end + 40 + j;
y_start = y_start + 20;

bar(x_start, y_start, x_end, y_end);
i++;

}

getch();

/* close the graph */

closegraph();
return 0;

}
Output