In the previous lesson, you learned about co-ordinate system. You know than a point is plotted on Cartesian plane with x-axis and y-axis.
A point has two values – 


Graph of Linear Equations
Therefore, expressions involving two variable can also be plotted using the Cartesian plane known as Graph of an Equation.
So, all points that satisfy the equation will give the graph of the equation.
Example:
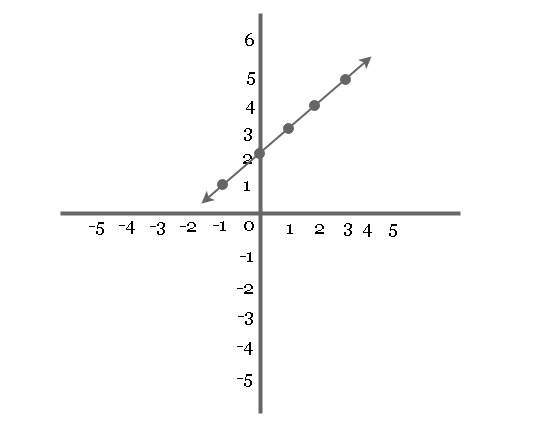
Plot graph of equation for 

Solution:
Given equation
You can plot the graph using co-ordinate system, but before that find all x and y values that counts as a point.
| X-value | Y-value | Point |
| -1 | 1 | (-1, 1) |
| 0 | 2 | (0, 2) |
| 1 | 3 | (1, 3) |
| 2 | 4 | (2, 4) |
| 3 | 5 | (3, 5) |
Now, using these points you can plot the graph of the equation.

Non-Linear Equations
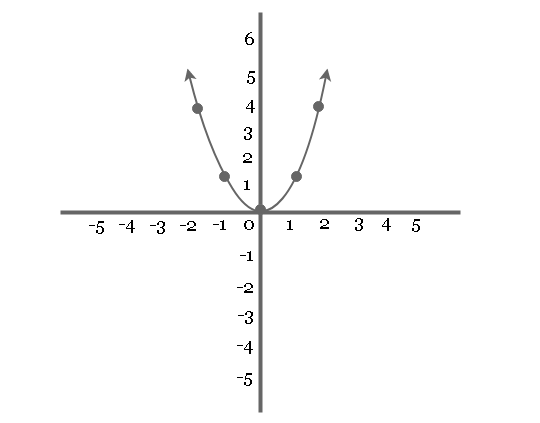
Not all equations are straight line, some equations are non-linear and give a curve for graph.Consider the following example.
Example 2:
Plot the graph of equation for 

Solution 2:
Given than
First, you must create a table of values that represent points on the graph.
| X-value | Y-value | Point |
| -2 | 4 | (-2, 4) |
| -1 | 1 | (-1, 1) |
| 0 | 0 | (0, 0) |
| 1 | 1 | (1, 1) |
| 2 | 4 | (2, 4) |
You need to plot a graph using these points and each point has

Points to Remember:
This is something that you can try on your own.
- Linear equation

- Quadratic equation


