Table of Contents
Graph of function does not remain the same. It changes its shape or position when values are added, subtracted or multiplied by the equation of the graph. This kind of change in the graph is called a transformation of the graph of functions.
You must be familiar with the transformation happens to a graph of function once the equation changes. You should be able to tell the changes in the graph by looking at the new graph of the equation.
Before you begin, learn about graph and graphs of equations, functions, a graph of functions. If you know them already skip ahead and continue reading.
Types of Graph Transformation
The graph transformation is broadly classified into two types.
- Transformation of Position
- Reflection
- Transformation of the shape of Graph
We shall discuss each of these transformations in more detail in coming sections.
Transformation of Position
This type of transformation changes the position of the original graph to left, right, top and bottom by a few units. The graph is no longer in its original position.
If  is a function and
  is a positive real number, then shift in the graph position is represented as
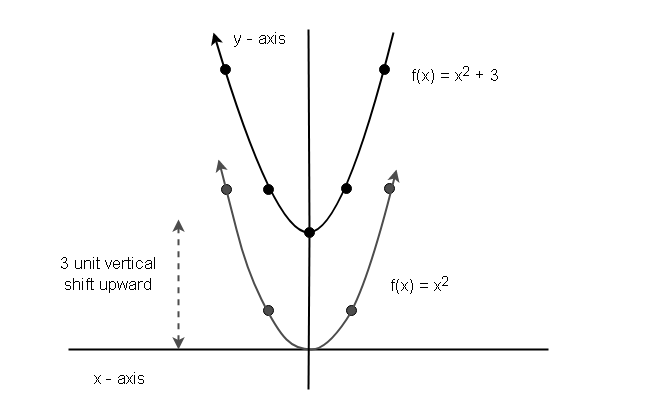
Shift of c units upward (y-axis) : 
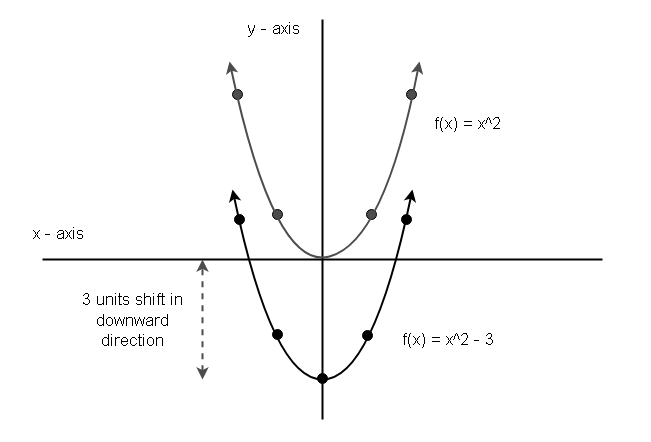
Shift of c units downward (y-axis) : 
Shift of c units left (x-axis) : 
Shift of c units right (x-axis) : 
To understand the positional shift in graph, check the examples in following sections.
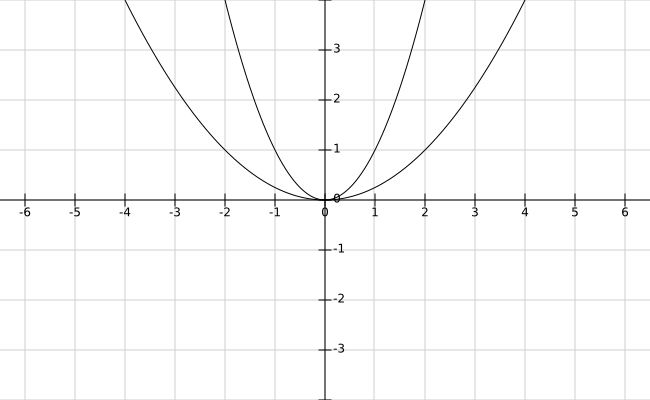
Example 1:
Let  and
and  . Then the function
  is given as follows.
h(x) = f(x) + c
substituting value  and , we get
h(x) = x^2 + 3
Create a table of values for  to plot the graph of the function.
| x | h(x) |
| -2 | 7 |
| -1 | 4 |
| 0 | 3 |
| 1 | 4 |
| 2 | 7 |
Using the above value plot a graph of function for  .
.
Example 2:
Now, we plot the graph of  .
.
Substituting for and , we get.
h(x) = x^2 - 3
Once, again create a table with values for .
| x | h(x) |
| -2 | 1 |
| -1 | -2 |
| 0 | -3 |
| 1 | -2 |
| 2 | 1 |
You can plot a graph using the above table.
Example 3:
The horizontal shift in a graph of a function is different from vertical shift because the value of a range is unaffected, but the value of domain x is increased or decreased. Thus causing right or left shift horizontally.
Suppose be the function and be the positive real constant. Then
 implies
In other words, value of  in is reduced by units in to get the output.
\begin{aligned}
&h(5) = f(5 - 3)\\\\
&= (5 - 3)^2\\\\
&= 2^2\\\\
&= 4
\end{aligned}
Let us now plot the graph of function .
| x | f(x – 3) | h(x) |
| 3 | f(0) | 0 |
| 2 | f(-1) | 1 |
| 4 | f(1) | 1 |
| 1 | f(-2) | 4 |
| 5 | f(2) | 4 |
The graph of function look like the following.
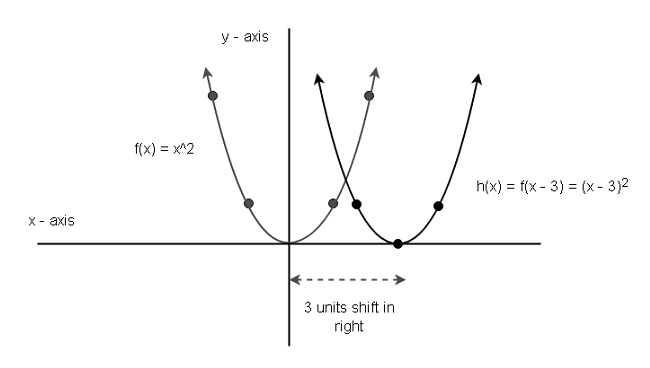
Clearly, the graph shifted to 3 units right horizontally.
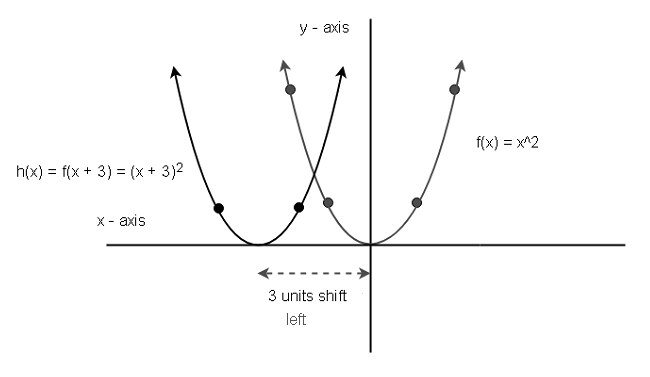
Example 4:
The left shift transformation is similar to the right shift. Let  . The function and .
The graph of this function will look like the following. The procedure to plot the graph is similar to the right shift transformation.
Combining More Than one Shift
It is possible to combine two or more shifts. Consider the following functions.
\begin{aligned}
&f(x) = x^2\\\\
&g(x) = f(x - 3) = (x - 3)^2\\\\
&h(x) = g(x) + 1
\end{aligned}
It implies that
h(x) = (x - 3)^2 + 1
Therefore, the graph will shift 3 units right horizontally and shift 1 unit up vertically.
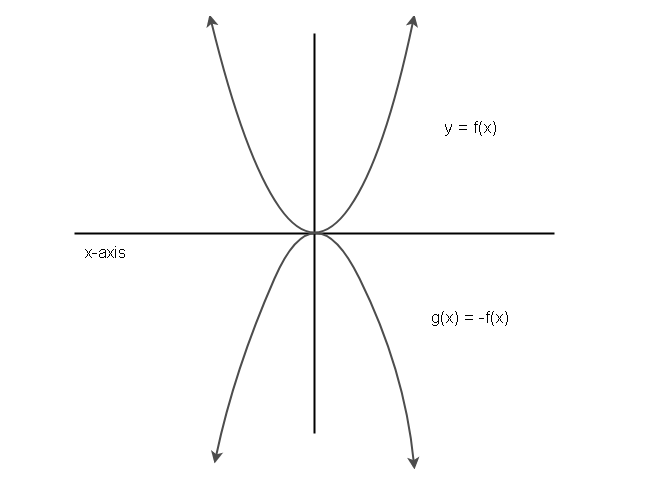
Reflection of a Graph
Reflection is another type of graph transformation. It does not change position but uses the x-axis or y-axis to reflect a graph of a function.
Reflection on x-axis: 
Reflection on y-axis: 
Let us see few examples to find out what reflection of a graph means.
Example 5:
Let be the original equation. If  represents the reflection of the function on x-axis, then the graph will look like below diagram.
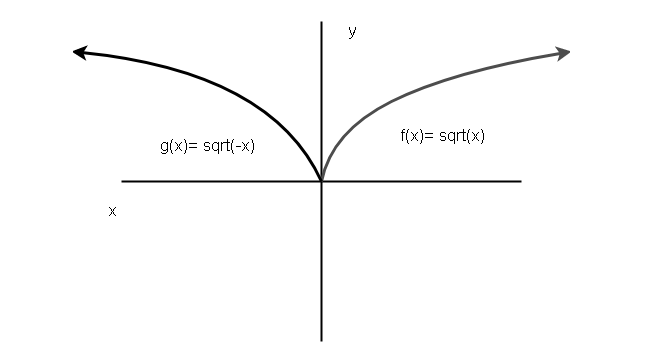
Example 6:
Let us take another example for reflection along y-axis. The function  is reflection of
  .
.
For this example, we will plot the graph of both and  .
.
Transformation of the Shape of Graph
The transformation of position or the reflection does not change the shape of the graph itself. It just moves the graph to a different location in the coordinate system. If is the graph of function then transformation is represented by  , where it is a vertical stretch if
  and vertical shrink if
  .
.
If is the graph of function then its transformation is  , where it is a horizontal shrink if and horizontal stretch if .
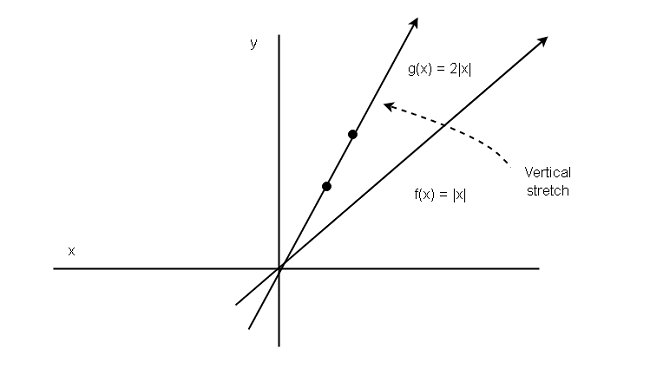
Example 7:
To understand the vertical transformation of shape, consider an example. Let  be a function and be a real constant.
You have two cases, case 1 when  and case 2 with . Suppose
  then
then
 , we know that this is case 1 and result in a vertical stretch.
Find all the points to plot the graph of function  .
.
| x | f(x) = |x| | g(x) = 2|x| |
| 0 | 0 | 0 |
| 1 | 1 | 2 |
| 2 | 2 | 4 |
| 3 | 3 | 6 |
| 4 | 4 | 8 |
You can easily plot the graph of function using the above points, which is given below.
Suppose , then its case 2 – vertical shrink. Let us plot the graph of the equation for case 2 when  .
.
| x | f(x) = |x| | g(x) = 1/2|x| |
| 0 | 0 | 0 |
| 1 | 1 | 1/2 |
| 2 | 2 | 1 |
| 3 | 3 | 3/2 |
| 4 | 4 | 2 |
The graph of the function  is given below.
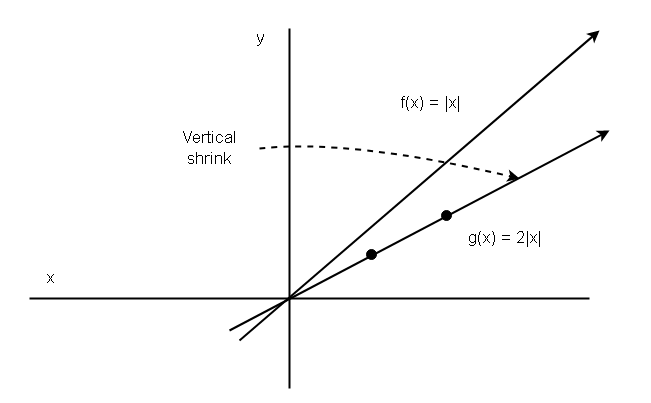
The graph of function shows that the vertical shape transformation has happened.
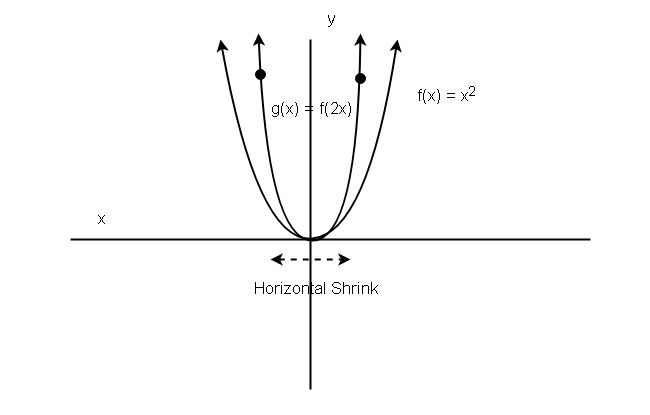
The horizontal shape transformation also happens in the same way. Let be the function, and be the horizontal shrink when and horizontal stretch when .
Suppose for horizontal shrink and for horizontal stretch respectively. Then the graph of function is given below.
| x | f(x) = x^2 | g(x) = f(2x), c > 1 | g(x) = f(1/2x), 0 < c < 1 |
| 2 | 4 | 16 | 1 |
| 1 | 1 | 4 | 1/4 |
| 0 | 0 | 0 | 0 |
| -1 | 1 | 4 | 1/4 |
| -2 | 4 | 16 | 1 |
Example 8:
The graph of function g(x) with horizontal shrink.
Example 9:
Similarly, we can plot the graph of horizontal stretch.