Table of Contents
A bar chart is used to display statistical data. The 3d bar chart is a type of bar chart in which each bar represents a value. The greater the value, the longer the 3d bar in the 3d bar chart. In this article, you will learn to write a program that will draw a 3d bar chart on the screen.
This program is written using Turbo C++ 3 compiler on a windows 7 64-bit computer.
Problem Definition
We want to write a program that will display a 3d bar chart on the screen. Each bar must have a value associated with it. The program to display 3d bar chart goes through the following steps.
- Declare all graphics and non-graphics variables.
- Initialize the variables.
- Initialize the graphics.
- Set the fill style for 3d bars.
- Set values for each 3d bar.
- Draw the 3d bar.
- Close the graph.
Program Code – 3D Bar Chart
/* Program to create a 3d bar-chart in C */

#include <stdio.h>
#include <stdlib.h>
#include <conio.h>
#include <graphics.h>

int main()
{
/* Variable declarations */

int gdriver, gmode,i,j;
int xs,xe, ys, ye, x, y;

/* Variable initialization */
gdriver = DETECT;

/* Graph initialization */
initgraph(&gdriver, &gmode, "d:\\turboc3\\bgi");

/* set the fill style */

setfillstyle(SOLID_FILL,LIGHTRED);

/* Draw the 3d bar chart */
x = 180;
y = 25;
outtextxy(x , y , "75000");
outtextxy(x + 50 , y + 50, "55000");
outtextxy(x + 100 , y + 100 , "45000");
outtextxy(x + 170, y + 170 , "30000");
outtextxy(x + 230, y + 230 , "20000");
j = 55;
xs = 100;xe = 150, ys = 10, ye = 320;
for(i = 0; i<5;i++)
{

xs = xs + j;
ys = ys + j;
xe = xe + j;

bar3d(xs, ys, xe, ye, (xe - xs)/4, 1);
}
getch();

/* close the graph */

closegraph();
return 0;
}
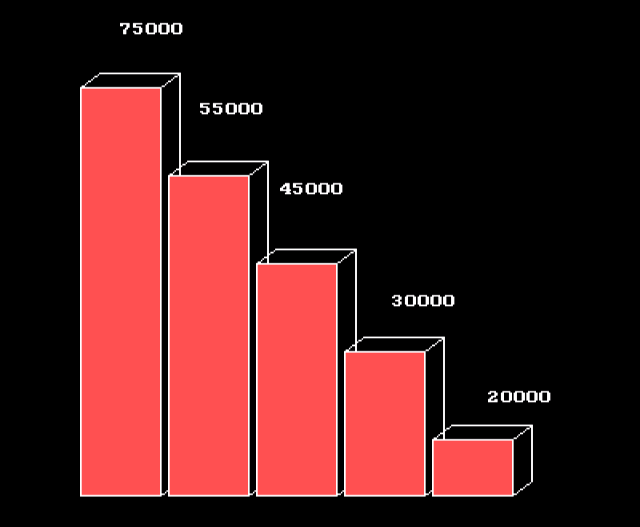
The following code section gives the values to each bar in the graph. The graphics text is displayed on the top of each 3d bar.
outtextxy(x , y , "75000");
outtextxy(x + 50 , y + 50, "55000");
outtextxy(x + 100 , y + 100 , "45000");
outtextxy(x + 170, y + 170 , "30000");
outtextxy(x + 230, y + 230 , "20000");
Output – 3D Bar Chart