Table of Contents
In this article, you will learn to write a C program to draw bar diagram with data input by user.
This program is written using Turbo C++ compiler installed on a Windows 7 64-bit PC. The compiler supports C language and the header Graphics.h is used to draw the chart.
Problem Definition
In this C example program, you will do following task:
- Ask user to input data for the bar diagram.
- Initialize the graph.
- Choose correct position on the screen to draw the graph.
- Write the labels for bars.
- Draw the bars according to data input by user.
- Close the graph.
For the purpose of this example:
In a university the number of application received in last five years is given below. Write a C program to display the data using bar chart.
| Year | Number of Students |
| 2013 | 20 |
| 2014 | 100 |
| 2015 | 70 |
| 2016 | 50 |
| 2017 | 120 |
Program Code – Bar Diagram With Data
/* C++ Program To Display following data:
Year No. Of Students
2013 20
2014 100
2015 70
2016 50
2017 120
------------------------------ */
include "graphics.h"
include "stdlib.h"
include "stdio.h"
include "conio.h"
include "dos.h"
int main(void)
{
int gdriver=DETECT, gmode;
int n,i,x1,x2,y1,y2, yr = 1950;
/* Initialize the Graph */
initgraph(&gdriver,&gmode,"D:\TurboC3\BGI");
/* Initialize the variable */
x1 = 50;
x2 = 50;
y1 = 350;
y2 = 350;
clrscr();
/* Display the data label year */
outtextxy(90,375,"1950");
outtextxy(140,375,"1955");
outtextxy(190,375,"1960");
outtextxy(240,375,"1965");
outtextxy(290,375,"1970");
printf("\t\t\tBAR CHART\n");
/* Set Color of the bar chart */
setfillstyle(SOLID_FILL,RED);
/* Display the data */
for(i=1;i<=5;i++)
{
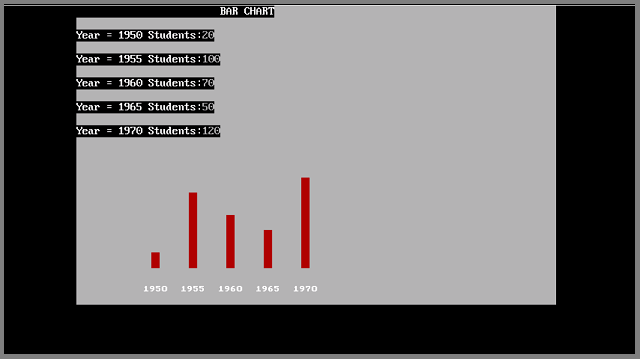
printf("\nYear = %d Students:",yr);
scanf("%d",&n);
y2=y2-n; x2=x2+50; x1=x2+10; bar(x1,y1,x2,y2); yr=yr+5; y2 = 350;
}
/* Close the Graph */
getch();
closegraph();
return 0;
}Output – Bar Diagram With Data