You can create reports from a database using visual basic 6. To create this project, you need visual basic 6.0, Microsoft Access 2003 and above, Windows XP and above as operating system. In this example project, we do the following
- Create a database with Microsoft Access
- Create a data project in visual basic 6
- Connect the vb 6 project to the database
- Import all the fields and data to generate a report
- Test our project and make sure it works correctly.
Create A Database with Microsoft Access
The first step in this project is to create a simple database with a single table in Microsoft access. For the purpose of this exercise, we are using Access 2013.
Create a blank database called product_list and save it as product_list.mdb. The database must be in access 2002-2003 format (.mdb).
In the database, create a table called Products and insert following data.
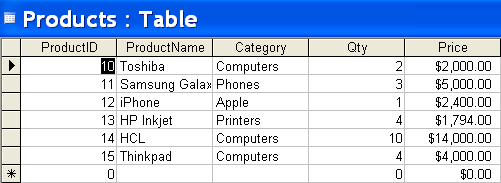
You can choose data types for each field as per your wish. It does not affect the project because this is the only table we are going to use.
Create A Data Project in Visual Basic 6
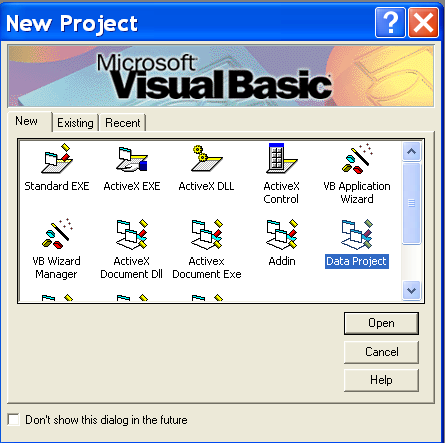
Once the database is ready, our next step should be to create a data project in visual basic 6 software. As soon as you launch the VB 6, you get an option to select the type of projects you want to start.
Choose “Data Project”. See the image below.
The first thing you must do is to double click the “DataEnvironment 1” under Project Explorer windows.
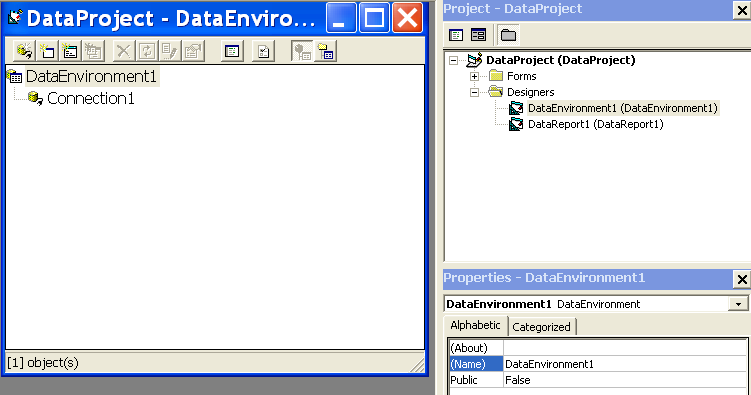
This will bring the DataEnvironment1 windows.
Connect The DataEnvironment1 to Product_list Database
From the DataEnvironment1 windows, right-click the Connection1, and go to properties.
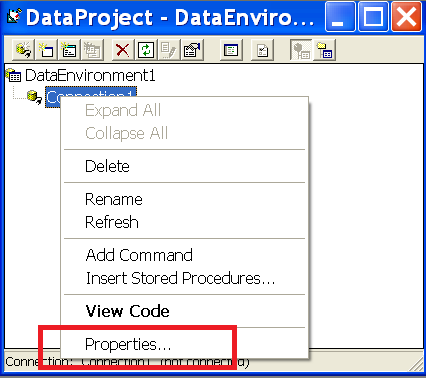
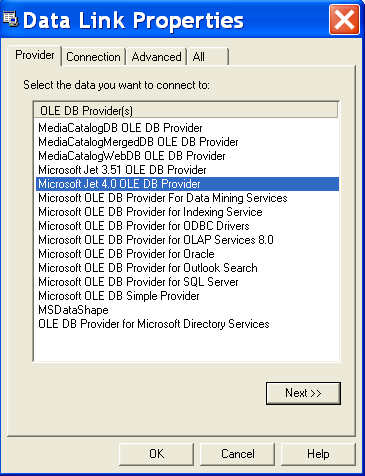
The data link properties will open up. You must select ” Microsoft Jet 4.0 OLE DB Provider” and click Next.
The next tab is Connection, under ‘Select or enter a database name’, click the (…) to browse to the database product_list.mdb and select it.
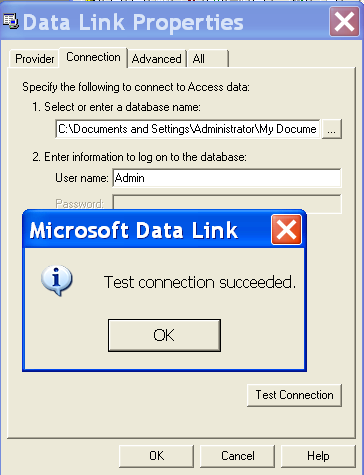
The connection must be successful if previous steps are done correctly. If connection fails, check the error and fix it. Click OK to close the data link window.
You are back to DataEnvironment1 window.
Import All Fields to DataReport1
Before we import fields from our Product table in product_list database. We must create a command1 in DataEnvironment1 window.
Right click the Connection1 and select Add Command option shown below.
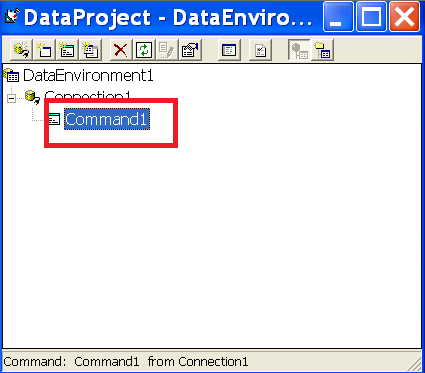
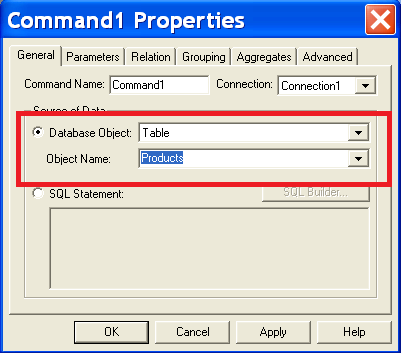
Right click Command1 and click Properties. The Command1 properties will open, you must select ‘Database Object’ as Table under Source of data.
Select the table “Products” under Object Name.
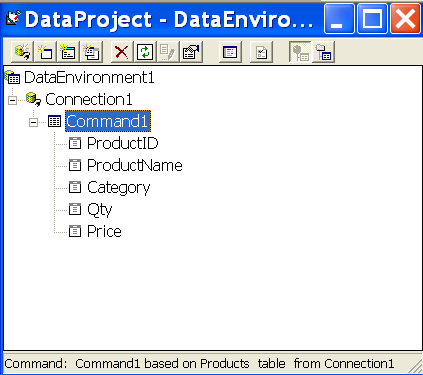
The table fields will appear under Command1 as follows.
The next step is to click the DataReport1 under Project Explorer on the right side.
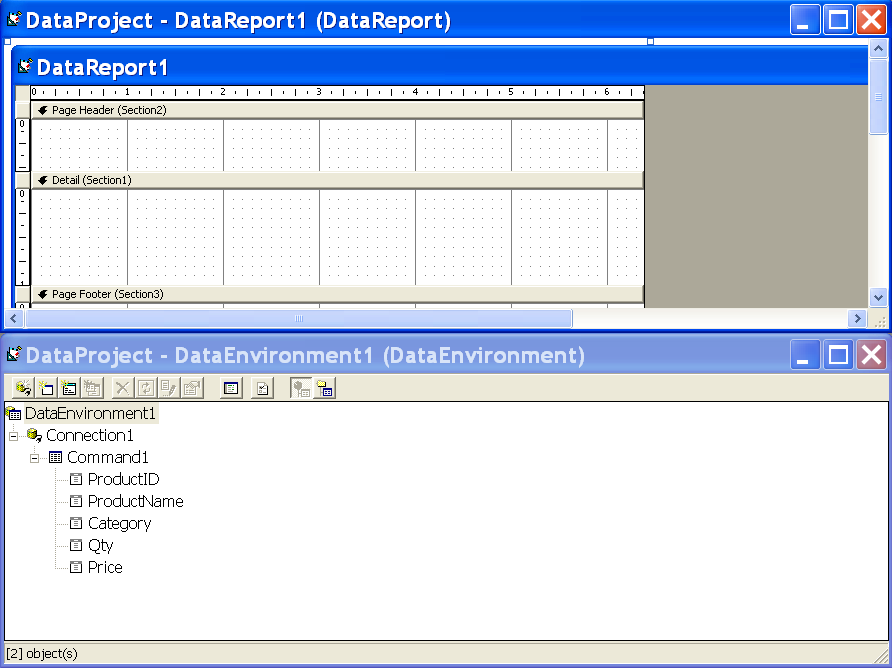
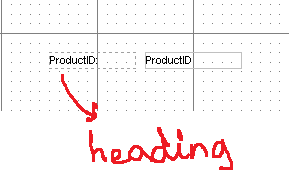
Now, you must drag all the fields from the Command1 to Details (Section1) in DataReport1. Note that there are two columns created representing each field. The first field is headings, therefore, drag it to Page Header(section2) in DataReport1.
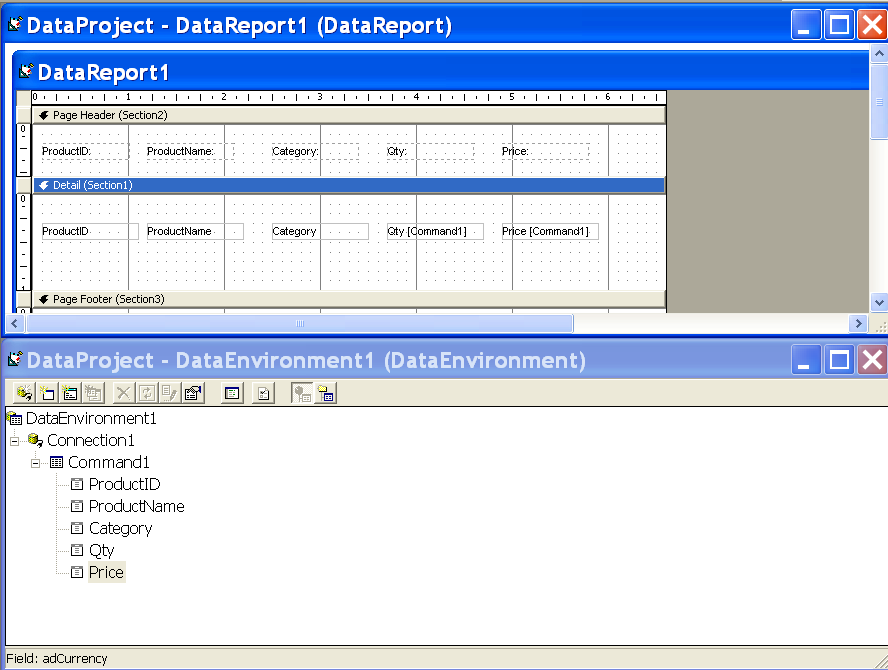
Note that you can choose any field to add or delete from the report. You have absolute control over how you want the report to appear.
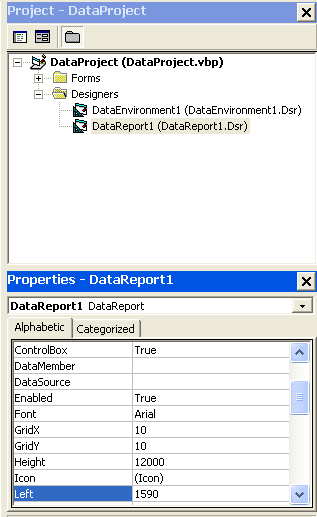
In the next step, go to properties of DataReport1 in the Project Explorer.
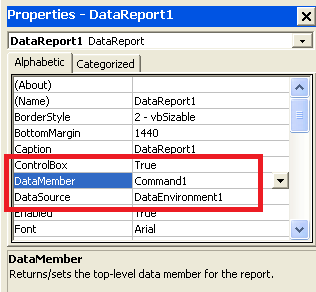
The DataReport1 has two properties you need to set.
DataMember : Command1
DataSource: DataEnvironment
First you must select the data source and then data member.
Test The Project and Viewing Data Report
In this final section, we will test the report generation. The data project has a form where you need to create two buttons. See the image below.
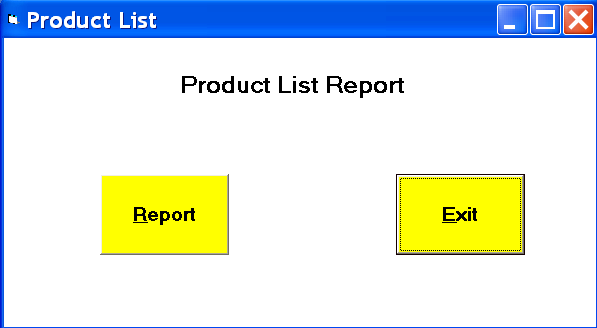
Properties Of Form
Name : frmDataEnv
Caption: Product List
BackColor: &H00FFFFFF&
Width : 9000
Height: 5000
Properties of Label
Name : lblBanner
Caption: Product List Report
BackColor:  &H00FFFFFF&
Font: Bold 18 PX MS Sans Serif
Properties of Buttons
Name : cmdExit
Caption: &Exit
BackColor:  &H0000FFFF&
Style: 1- Graphical
Font: 14 Bold Ms Sans Serif
Add following code for exit button.
Private Sub cmdExit_Click()
Unload Me
End Sub
Properties of report button.
Name : cmdReport
Caption: &Report
BackColor: &H0000FFFF&
Style: 1-Graphical
Font: 14 Bold Ms Sans Serif
Add the following code to show reports when the report button is clicked.
Private Sub cmdReport_Click()
DataReport1.Show
End Sub
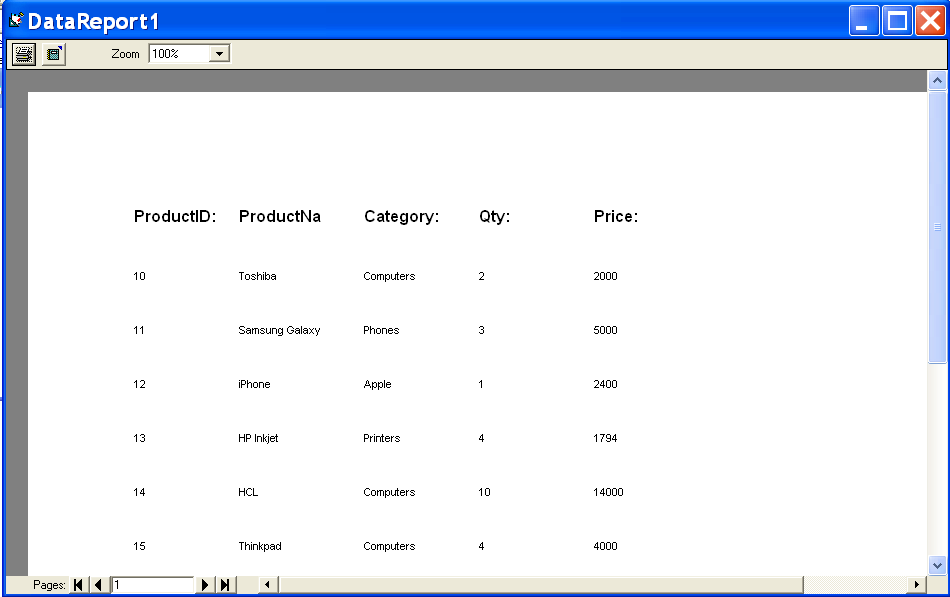
When we run the program and click on the Report button, you should see a report generated from the Access database, like the one above. The Exit button will close the VB program.