In the previous lesson, you learned about graph of equations which is points on a Cartesian plane. The graph of equation has some other interesting characteristics. You will learn about two such properties in this lesson – Intercepts and Symmetry of Graph.
Intercepts
The intercepts are the points where graph touches the x-axis or y-axis. There are only two types of intercepts in a Cartesian plane.
- x-intercept is given be a point
 .
. - y-intercept is given by a point
 .
.
A graph can have no intercept, one intercept and many intercepts.
Example:
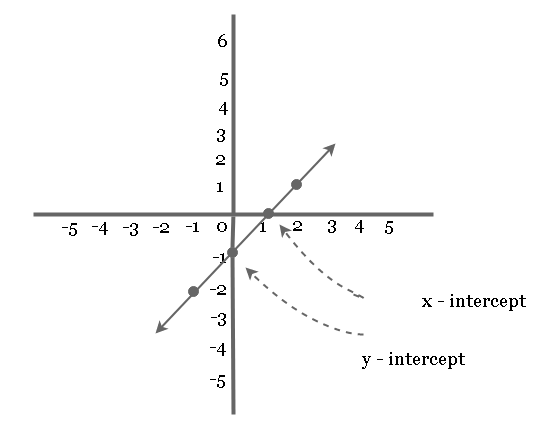
Find the intercepts of equation ![]() and plot the graph.
and plot the graph.
Solution:
Given that ![]() ,
,
You know that x-intercept the value of ![]() .
.
\begin{aligned}
&0 = x - 1\\ \\
&-x = -1\\ \\
&x = 1
\end{aligned}
Therefore,
The x-intercept of graph is point ![]() .
.
Similarly,
For y-intercept the value of ![]() .
.
\begin{aligned}
&y = 0 - 1 \\ \\
&y = -1
\end{aligned}
Therefore,
The y-intercept is the point ![]() .
.
Plotting the graph
To plot the graph of equation, you need to find other points on the equation.
| | ||
| -1 | -2 | (-1, -2) |
| 0 | -1 | (0, -1) |
| 1 | 0 | (1, 0) |
| 2 | 1 | (2, 1) |
Let’s plot the graph of equation ![]() .
.


Symmetry of Graph
The second property of graph is symmetry. The axis of Cartesian plane divides the graph in perfect halves is what we call as the symmetry of graph.
There are 3 rules regarding the symmetry of graph.
- A graph is symmetric with respect to x-axis, whenever
 is on the graph
  is also on the graph.
 - A graph is symmetric with respect to y-axis, whenever
 is on the graph
  is also on the graph.
 - A graph is symmetric with respect to origin, whenever
 is on the graph
  is also on the graph.
Example:
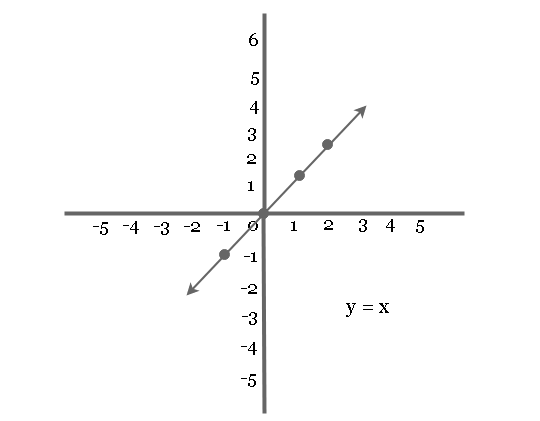
Plot graph ![]() symmetric to origin.
symmetric to origin.
Solution:


Example:
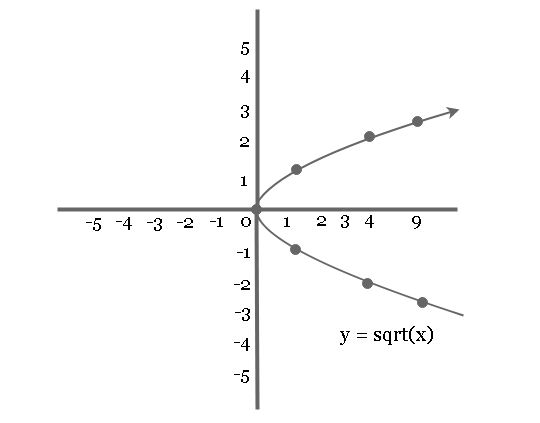
Plot graph of equation ![]() which is symmetric to x-axis.
which is symmetric to x-axis.
Solution:


Example:
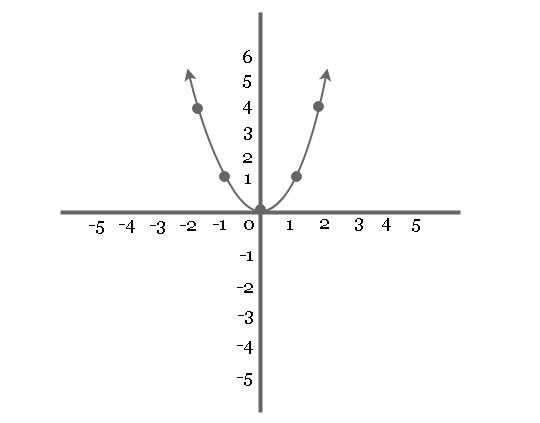
Plot graph of equation ![]() symmetric to y-axis.
symmetric to y-axis.
Solution:
