Table of Contents
You can identify a function by looking at its graph. This article, we explore different types of function and their graphs.
Prerequisite to learn from this article is listed below.
There is a relationship between a function and its graph. With the help of a graph of function, you can discover may properties which the algebraic form does not provide.
The graph of functions helps you visualize the function given in algebraic form. By look at an equation you could tell that the graph is going to be an odd or even, increasing or decreasing or even the equation represents a graph at all.
- Linear Function
- Squaring Function
- Cubic Function
- Square Root Function
- Reciprocal Function
- Step Function
- Piece-Wise Function
Linear Functions
The linear functions are straight lines. Read the following article to learn more about linear function.
Squaring Functions
The graph of squaring function is commonly known as a parabola which is a U-shaped curve.The diagram for squaring function  is given below.
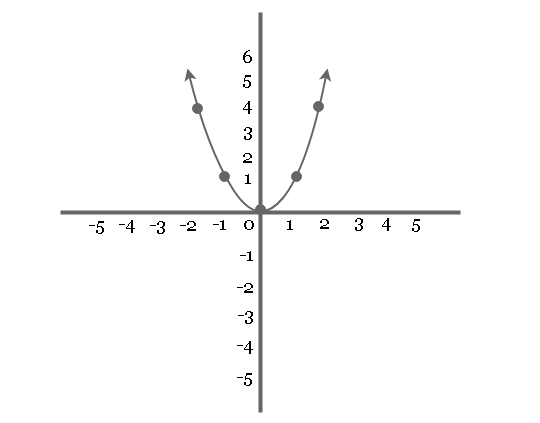
Properties of a Squaring Function
The properties of a squaring function are the domain and range, intercepts, etc.
- The domain of squaring function set of all real numbers that corresponds to x-axis.
- The range of squaring function is all non-negative real numbers because the graph is U-shaped.
- The function is an even function because it is symmetric along the y-axis.
- The intercept of squaring function is at point (0, 0).
- The graph of squaring function has relative minimum at (0, 0).
- The squaring function graph is decreasing between interval
 .
. - The graph is increasing between the interval
 .
.
 .
. .
.Graph of Cubic Function
The graph of cubic function is in positive side and negative side unlike squaring function which is only on positive side.
f(x) = x^3
If you plot the graph then it look like the one below. Let us use the following table to plot the graph of cubic function.
| x | y = f(x) = x^3 | point |
| -2 | -8 | (-2, -8) |
| -1 | -1 | (-1, -1) |
| 0 | 0 | (0, 0) |
| 1 | 1 | (1, 1) |
| 2 | 8 | (2, 8) |
The graph of cubic function look like the following.
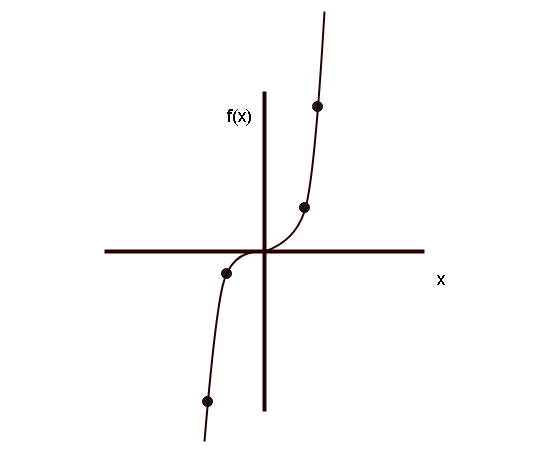
Properties of Cubic Function
Cubic function has following properties.
- The cubic function is an odd function.
- The cubic function is symmetric along the origin.
- The domain of cubic function is set of all real numbers.
- The range of cubic function is set of all real numbers because the function has interval between
 .
. - The intercept of the graph is at (0, 0).
- The function is always increasing between the interval – .
 .
.Graph of Square Root Function
A graph of function  where a value of
  results in
  .
.
f(x) = \sqrt{x}Let us plot the graph of the square root function by obtaining some points. We used calculator to compute some values.
| x |  | point |
| 4 | 2 | (4, 2) |
| 3 | 1.73 | (3, 1.73) |
| 2 | 1.41 | (2, 1. 41) |
| 1 | 1 | (1, 1) |
| 0 | 0 | (0, 0) |
The graph of the squaring function is given below.
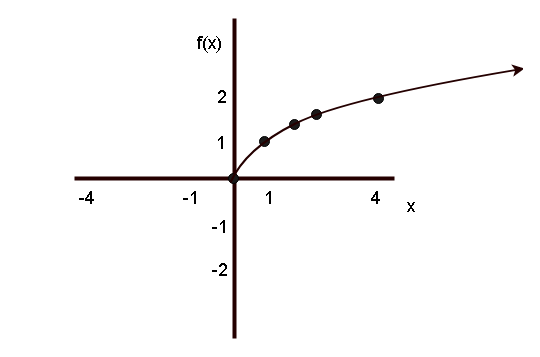
As you can see that the graph is only on positive side for both and .
Properties of Squaring Function
The graph of squaring function is given below.
- The domain is set of non-negative real numbers .
- The range is is set of non-negative real numbers .
- The intercept of the graph is at
 .
. - It is increasing between the interval .
 .
.Graph of Reciprocal Function
Let be a function, then
f(x) = \frac{1}{x}is called a reciprocal function.
To plot the graph of reciprocal function, let us find all the points first.
| x | f(x) = 1/x | point |
| -3 | -1/3 | (-3, -1/3) |
| -2 | -1/2 | (-2, -1/2) |
| -1 | -1 | (-1, -1) |
| 0 | undefined | undefined |
| 1 | 1 | (1, 1) |
| 2 | 1/2 | (2, 1/2) |
| 3 | 1/3 | (3, 1/3) |
The graph of reciprocal is shown below.
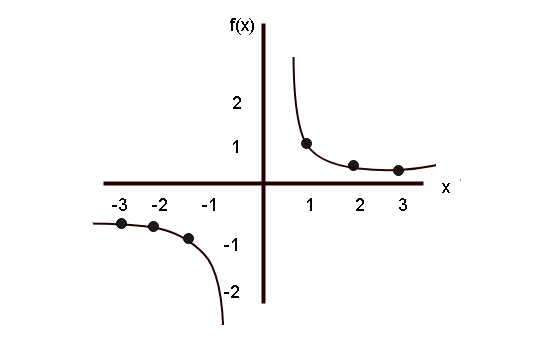
Properties of Graph of Reciprocal Function
The reciprocal function is symmetric along the origin, but it never touches the origin itself. The properties of a reciprocal function is given below.
- It is odd function because symmetric with respect to origin.
- It has no intercepts.
- The domain of reciprocal function is between
 .
. - The range of reciprocal function is .
- It is decreasing in the interval .
- and increasing in the interval .
 .
. .
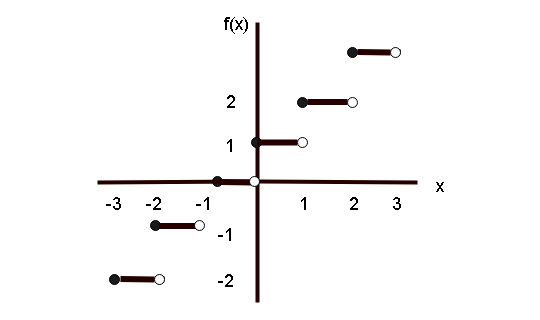
.Graph of Step Function
The graph of step function actually look like a staircase with steps.
Let ![f(x) = [[x]] + 1](https://notesformsc.org/wp-content/ql-cache/quicklatex.com-1441407aae4284f5c254485d0e34a2c5_l3.png "Rendered by QuickLaTeX.com") , be the step function where
, be the step function where
[[x]] mean find the a value ‘greater than or equal to x‘.
We must find points to plot the graph of step function.
| x | f(x) = [[x]] + 1 | points |
| -2 | -1 | (-2, 1) |
| -1 | 0 | (-1, 0) |
| 0 | 1 | (0, 1) |
| 1 | 2 | (1, 2) |
| 2 | 3 | (2, 3) |
The graph of step function is shown below.
Properties of Step Function
The properties of step function are given below.
- Domain is set of all real numbers.
- Range of function is set of all integers.
- The y-intercept is (0,0) and x-intercept is [0, 1).
- The graph is constant between each pair of integers.
- The graph jumps vertically one unit for each y-value.
Graph of Piece-wise Function
The graph of piecewise function is already discussed in previous lessons.
If you remember these basic graph of functions used in algebra, then it is easier to learn higher and complex graphs. Later , when you learn calculus, visualizing concepts is much easier with a graph of function.