Table of Contents
In the previous lesson, you learned about functions and different ways to represent a function. One of the way to represent the function is using graphs. In this lesson, you will explore the graphs of functions and understand how to determine the domain and range of function from its graph. You will learn about vertical line testing and how to find zero of a function.
The graph of a function is the ordered pair  .
.
x = length along the x-axis.
y = f(x) = length along the y-axis.
Let’s draw the graph of a function and see how it works.
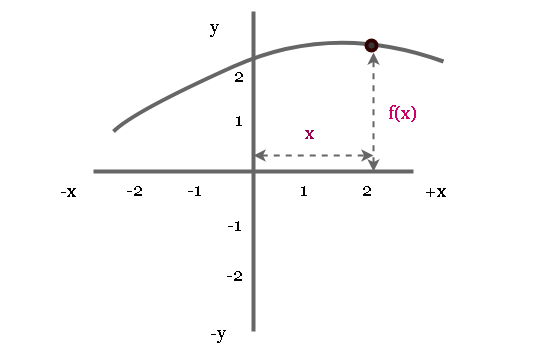
The above diagram clearly shows that the graph has  for some input x.
Finding Domain and Range using Graph of Function
You can easily find the domain and range of a function using graph of the function. Plot the graph of the function using algebraic equation of the function.
See the graph below
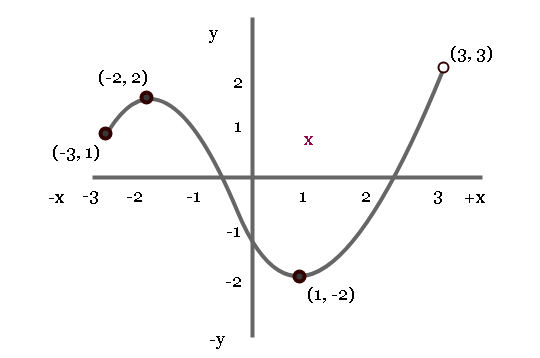
In the graph some points are closed or filled and some of them are not-filled or open.
- The points (-3, 1) , (-2, -2) and (1, -2) are in the domain of the function
- However, (3, 3) is not defined and not in the domain of the function.
Therefore,
The domain of the function is between the interval [-3, 3). We have taken the left most and right most value of x as the domain. But do not forget to check if the interval is open or closed.
Range of the Function
In the diagram above, the highest point and the lowest point defined are (-2, 2) and (1, -2) respectively. Then the range of the function using graph is the closed interval [2, -2] because both points are defined.
Vertical Line Test for Graph
You can determine whether a graph belongs to a function or not, using a vertical line test.
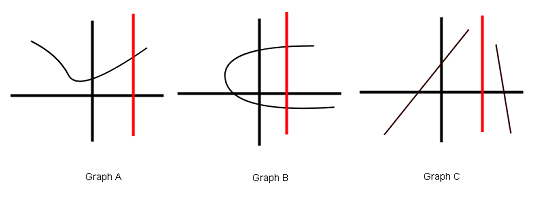
In the above diagram the red line, intersect the graph A at one place. The graph A belongs to a function. The line crosses the graph B at two places. It is not a graph of a function.
The graph sometimes is not defined for some functions and as a result the line will not intersect the graph at all. But this does not mean that it is not a graph of a function, just because it is not defined as in the case of graph C.
Zero of a Function
Previously you learned about the intercepts of an equation. The graph of a function has x-intercept which is (a, 0). The zero of the function is the value of x for which  .
.
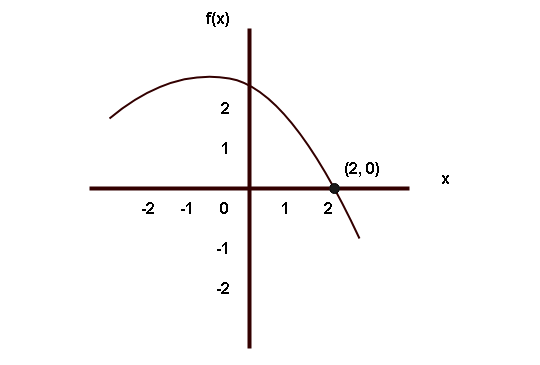
In the graph shown above, the zero of the graph is the point (2, 0) where the graph intersects the x-axis. Some graphs have more than one zero because they intersect the x-axis more than once.