Table of Contents
Certain functions are symmetric in nature and quadratic function is one of them. If you remember from previous articles, we classified the functions as even and odd which means even functions are symmetric over y-axis and odd functions are symmetric over x-axis in a 2d coordinate plane.
What is a quadratic function ?
A quadratic function is a polynomial function with greatest exponent or degree of 2. Any function of the following form,
f(x) = ax^2 + bx + c
where  are real numbers and
  .
.
We can use the equation above and plot a graph for the quadratic function.
The Parabola
The graph of quadratic function is called the parabola. Since, the quadratic function is even, the graph is symmetric over y-axis. Suppose  is a quadratic function where coefficient
  . Then the quadratic function is
  . The graph of this function is given below.
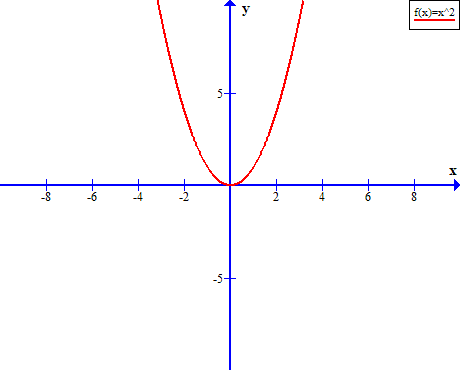
If you notice, the above function can be written as  where
where  . If the coefficient of
  term is greater than 0, that is,
  , then the parabola open upwards.
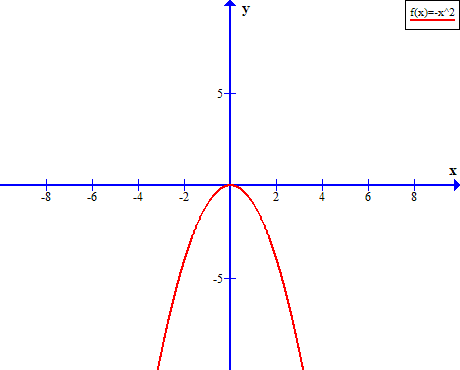
Let us say,  , then quadratic function
  is downward facing.
Whatever may be the type of parabola, certain features are common to all of these parabolas. Let us discuss each on of them.
Features of Parabola
The parabola has certain common features despite various transformations. It does not matter whether graph of quadratic function is wide, narrow, upward facing, or downward facing, these features are always present.
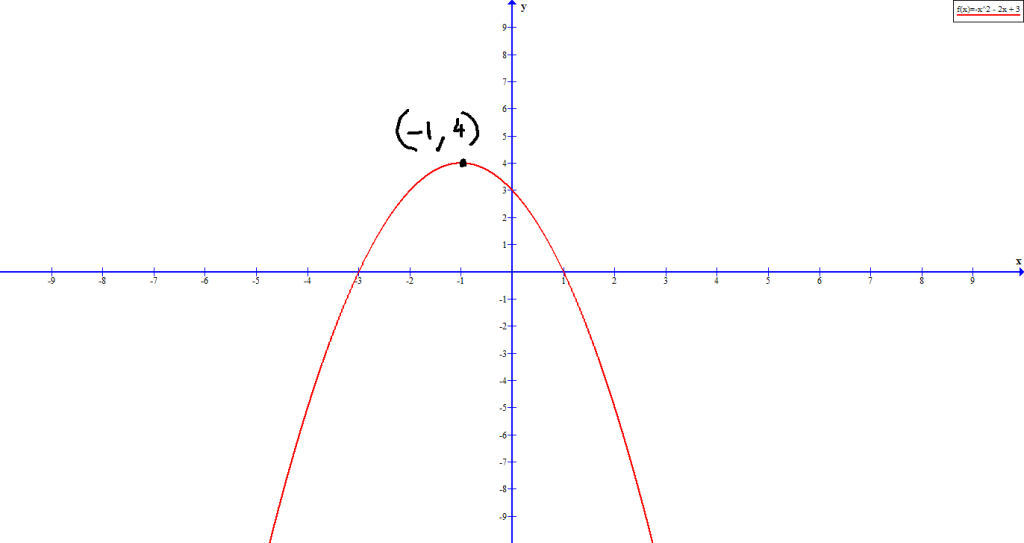
Consider the following quadratic equation,  and its graph.
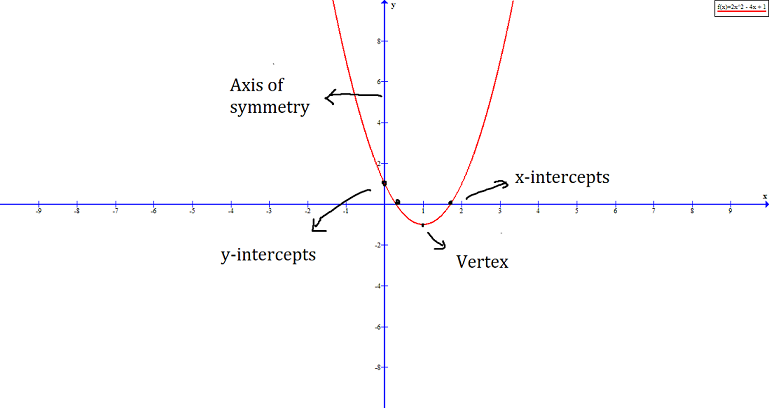
The common features of all parabola are:
- Axis of symmetry
- Vertex
- x-intercepts
- y-intercept
We shall now discuss each of them briefly.
Axis of Symmetry
The axis of symmetry is the y-axis because parabola is graph of a quadratic function which is even. Any even function reflects along the y-axis in a 2D coordinate plane.
Vertex of Parabola
The vertex of a parabola is lowest or the highest point in the graph. When the function is  , which means coefficient
  , then the vertex is at
  on the coordinate plane.
When the parabola is opening upward , the vertex is the lowest point in the graph.
When the parabola open downwards, which is  , the vertex is the highest point on the graph.
Now we know the vertex and parabola features. Note that the graph is transforming, and this gives us a standard form of quadratic equation.
Standard Form of Quadratic Equation And Transformation of Graph
The basic form of quadratic equation is where and  . The vertex of such a graph is at . If we apply transformation on the parabola, whose vertex
  is away from origin
  , we get:
f(x) = a(x - h)^2 + k
where .
Here are some important points to note:
- If
 , then the graph open upwards, else if , then the graph open downwards.
 - The transformed quadratic function from
 has a vertex
  .
. - When the value of
 is positive, the graph shifts unit to the right, and if
  , the graph shifts unit to left.
 - When the value of , then graph shifts upwards in y-axis, otherwise, it shift down k unit along the y-axis.
- The equation of axis of symmetry is
 where is the vertex.
 - The x-intercepts can be calculated by solving the quadratic equation, that is,
 .
. - The y-intercept can be calculated using
 .
.
 has a vertex
  is positive, the graph shifts
  , the graph shifts
  , then graph shifts upwards in y-axis, otherwise, it shift down k unit along the y-axis.
 .
. .
.Let us graph a quadratic equation in standard form.
Example #1
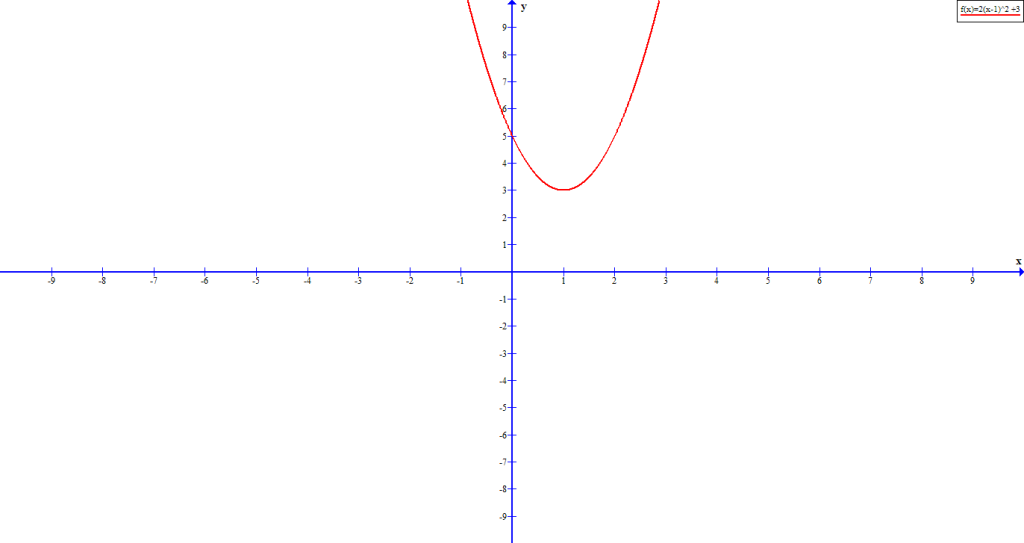
Graph the following quadratic equation:  .
.
Solution:
Before we construct the graph, let us observe a few things about this quadratic equation which is in standard form.
 , which means that the graph open upwards. The vertex is
  .
.
We know that the line of symmetry is  , therefore,
  . Also, the graph shifts upwards 3 units.
The y-intercept is  . There is no x-intercepts in the graph because the graph already shifted 3 units up in the y-axis.
Based on the information above we can construct the graph, which look like the following.
What if we are given equation in the form:  .
.
Graphing Equation Of Form: 
To solve equation of form , we need to change it into standard form. This is achieved through completing the square process.
Example #2
Change the given equation into standard form:  .
.
Solution:
Let the equation be perfect square.
\begin{aligned}
&2x^2 + 4x + 5 = 0\\ \\
&dividing \hspace{2 mm} all \hspace{2 mm}terms\hspace{2 mm} by\hspace{2 mm} 2\\ \\
&=x^2 + 2x + 5/2 = 0 \\ \\
&=(x^2 + 2x + 1) -1 + 5/2 = 0\\ \\
&Completing\hspace{2 mm} square \hspace{2 mm}and \hspace{2 mm}multiply \hspace{2 mm} by\hspace{2 mm} 2\\ \\
&=2(x + 1)^2 - 2 + 5 = 0 \\ \\
&=2(x + 1)^2 + 3 = 0
\end{aligned}
Now, in the standard form, it is easy to graph the equation. The vertex of the above equation is  . However, there is an easier way to get coordinates for vertex,
If , then its vertex is  , where
\begin{aligned}
&h = \frac{-b}{2a}\\\\
& f\left(\frac{-b}{2a}\right)
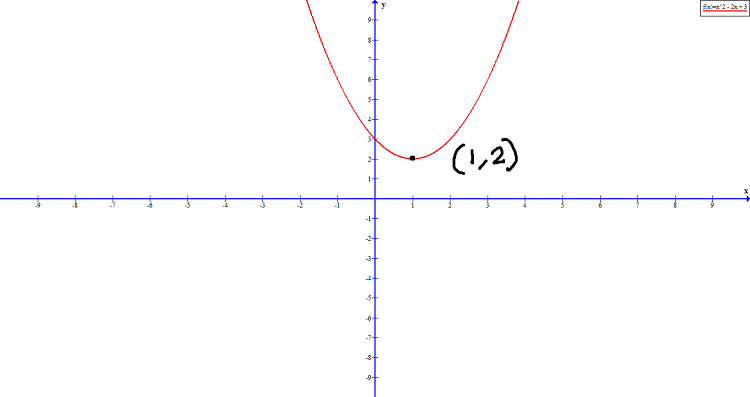
\end{aligned}Example #3
Find the vertex of equation: .
Solution:
Vertex is
\begin{aligned}
&h = \frac{-4}{4} = -1 \\\\
&k = f(-1) = 2(-1)^2 + 4 (-1) + 5 = 2 - 4 + 5 = 3

\end{aligned}
Therefore, the vertex is .
Maximum and Minimum Points
The quadratic equation problems are find three values starting point, maximum or minimum point on the graph, and ending of the graph. The x-coordinate value of vertex gives the location of maximum or minimum point, and y-coordinate value gives the value of maximum or minimum point in the graph of quadratic equation.