Previously you learned about functions, graph of functions. In this lesson, you will learn about some function types such as increasing functions, decreasing functions and constant functions. These concepts are explained with examples and graphs of the specific functions where ever necessary.
Increasing, Decreasing and Constant Functions
Functions are increasing, decreasing and constant when you plot the graph of the function in a coordinate system. Let’s define the meaning of these functions.
Increasing function
A function  is increasing in an interval for any
  and
and
- if

- implies

Example:
Let  be a function. Find all the values for the function to plot the graph.
| x | f(x) | (x, f(x)) |
| -1 | 2 | (-1, 2) |
| 0 | 1 | (0, 1) |
| 1 | 2 | (1, 2) |
| 2 | 5 | (2, 5) |
The graph of the function will look like the following.
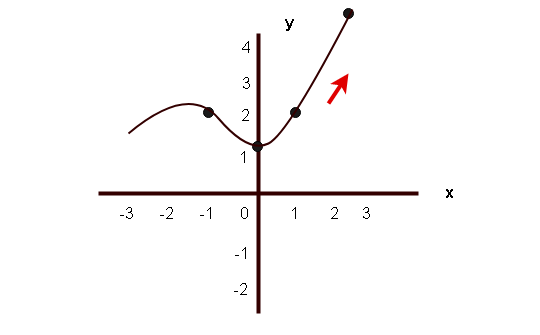
In the above graph, the function is increasing between the interval of (0, 2).
The value of is 0 and is 3,
The value of  is 1 and
  is 5.
is 5.
Therefore,
 implies is true and it is an increasing function.
Decreasing Function
A function is decreasing in an interval for any and
- if
- implies

Example:
Consider a function  . The function is a parabola. Let’s draw the graph of this function in a Cartesian plane or co-ordinate system.
Before plotting the graph, you need to find points for the graph of the function. A table of points is given below.
| x | f(x) | (x, f(x) |
| -2 | 4 | (-2, 4) |
| -1 | 1 | (-1, 1) |
| 0 | 0 | (0, 0) |
| 1 | 1 | (1, 1) |
| 2 | 4 | (2, 4) |
The graph of the parabola is given below.
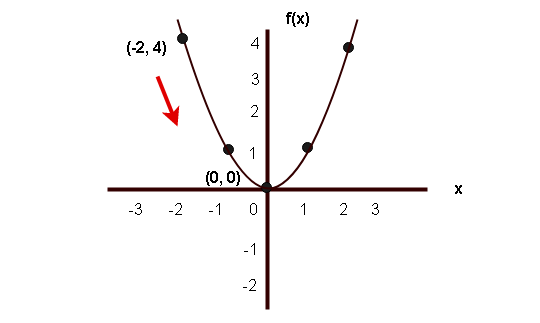
In the above graph, the function is decreasing between the interval ( -2, 0).
The value of is -2 and the value of is 0.
The value of is 4 and the value of is 0.
Then
is true and is also true. Hence, the function is a decreasing function between the interval  .
.
Constant Function
The function is a constant function in an interval for some and
- if
- implies

This is simplest form of graph of a function and such a function is always a straight line on the coordinate system.
Let  be the constant function. It means for any value of
  in the domain, the value of is 3.
The graph of constant function is given below.
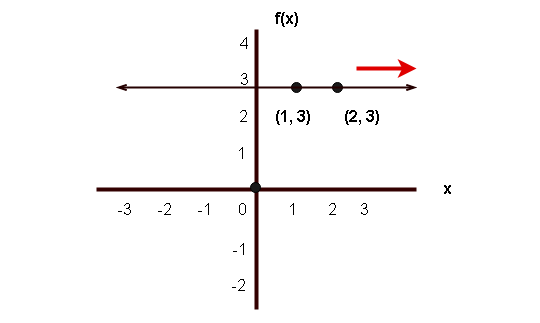
In the above graph of the constant function.
The value of is 1 and the value of is 2.
The value of is 3 and the value of is also 3.
Therefore,
and implies that the function is a constant function.