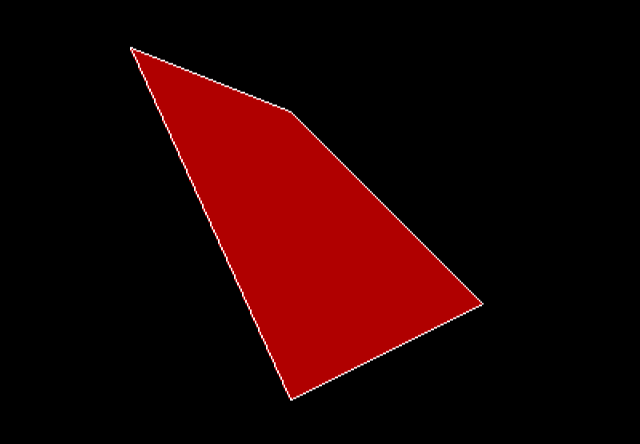
C Program to Draw and Fill Color in a Polygon
In the previous article, you learn to draw a polygon shape with N points. In this article, you will learn to draw a polygon and fill color in it using graphics functions.
Problem Definition
If you want to draw a polygon shape with N points, where a point is represented using $latex (x, y)&s=2$ coordinates, then use $latex drawpoly ( )&s=2$ function from graphics.h header file of C language.
But we want to draw a polygon and fill some color in it. To write a program that draws a polygon and fill color or pattern follow the steps given below:
- Declare all graphics and non-graphics variables.
- Initialize the variables.
- Initialize the graph while a path points to the graphics files – BGI.
- Initilize the polygon array where each pair is a point in the polygon.
- Set fill style and color for the polygon shape.
- Draw the polygon.
- Close the graph.
Program Code – fillpoly ( ) with Color
/* C Program to draw a Polygon and fill color in C language */

#include <graphics.h>
#include <stdio.h>
#include <stdlib.h>
#include <conio.h>

int main()
{
/* Declaring a variable */

int gdriver, gmode;

/* Polygon array to define points on the polygon shape */

int poly[10];

/* Initialize the variables */

gdriver = DETECT;

/* Initialize the graph and set path to BGI files */

initgraph(&gdriver, &gmode, "D:\\TURBOC3\\BGI");

/* Polygon Points in Pairs */


poly[0] = 20; /* 1st vertex */
poly[1] = 100;

poly[2] = 120;
poly[3] = 140; /* 2nd vertex */

poly[4] = 240;
poly[5] = 260; /* 3rd vertex */

poly[6] = 120;
poly[7] = 320; /* 4th vertex */

poly[8] = poly[0];
poly[9] = poly[1]; /* The polygon does not
close automatically, so we close it */

/* Set the fill style for the Polygon */

setcolor(getmaxcolor());

setfillstyle(SOLID_FILL, RED);

/* Draw the Polygon */

fillpoly(5, poly);

getch();

/* Close the graph */

closegraph();
return 0;

}
Output – Fillpoly ()
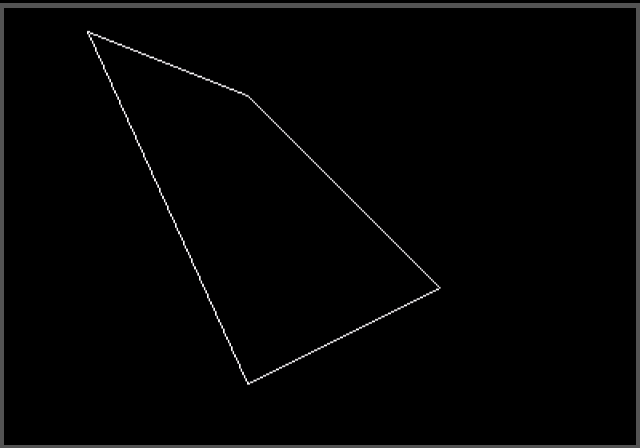
C Program to Draw a Polygon Shape
The C programming language graphics support allows creating polygon shapes with N points. Each of these N points must be a pair of coordinates. In this article, you will write a program to draw a polygon shape in C language.
Problem Definition
We wish to create a polygon shape with 4 points. Each of the points will be represented using a pair (x, y) where x is x-coordinate and y is y-coordinate in the x-axis and y-axis respectively.
The program must go through the following steps to create a polygon:
- Declare all variables including graphics variables and polygon array.
- Initialize all variables.
- Initialize the graph while the path is set to the graphics driver.
- Assign values to polygon array in pairs.
- Use drawpoly( ) function to draw the polygon shape.
- Close the graph.
Program Code – Polygon using drawpoly( )
/* C Program to draw a Polygon in C language */

#include <graphics.h>
#include <stdio.h>
#include <stdlib.h>
#include <conio.h>

int main()
{
/* Declaring a variable */

int gdriver, gmode;

/* Polygon array to define points on the polygon shape */

int poly[10];

/* Initialize the variables */

gdriver = DETECT;

/* Initialize the graph and set path to BGI files */

initgraph(&gdriver, &gmode, "D:\\TURBOC3\\BGI");

/* Polygon Points in Pairs */


poly[0] = 20; /* 1st vertex */
poly[1] = 100;

poly[2] = 120;
poly[3] = 140; /* 2nd vertex */

poly[4] = 240;
poly[5] = 260; /* 3rd vertex */

poly[6] = 120;
poly[7] = 320; /* 4th vertex */

poly[8] = poly[0];
poly[9] = poly[1]; /* The polygon does not
close automatically, so we close it */

/* Draw the Polygon */

drawpoly(5, poly);

getch();

/* Close the graph */

closegraph();
return 0;

}
Output
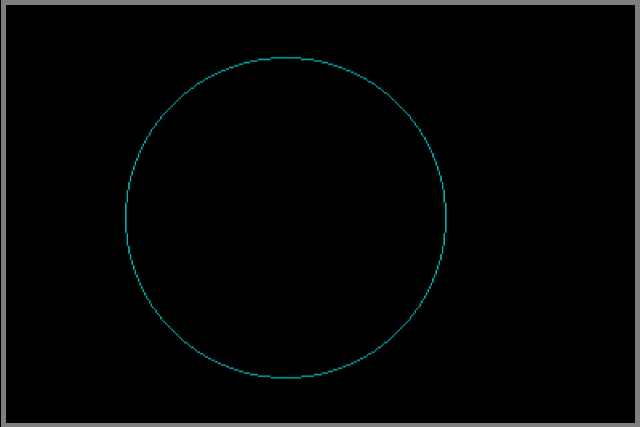
C Program to Draw a Circle
In this article, you will learn to draw a circle in C programming language. You must supply the appropriate information to draw the circle such as co-ordinates of the center, length of the radius and so on.
Problem Definition
We wish to draw a circle in C language using the builtin graphics header file. The function Circle() is called to draw a circle with radius n.
The program follows the steps given below:
- Declare all variables.
- Initialize the variables.
- Intialize the graph and set path to bgi files.
- Set the color for the circle.
- Draw the circle.
- Close the graph.
Program Code – Draw Circle
/* Program to draw a circle in C */
#include <stdio.h>
#include <graphics.h>
#include <stdlib.h>
#include <conio.h>

int main()
{
/* Variable declaration */

int gdriver, gmode;
int x, y, radius;

/* variable initialization */

gdriver = DETECT;

/* Graph initialization */

initgraph(&gdriver, &gmode, "d:\\turboc3\\bgi");


/* Set the color of the circle */

setcolor(CYAN);

/* Draw the CIRCLE */

x = 200;
y = 300;
radius = 100;

circle(x, y, radius);

getch();

/* close the graph */

closegraph();
return 0;

}
Output – Draw Circle
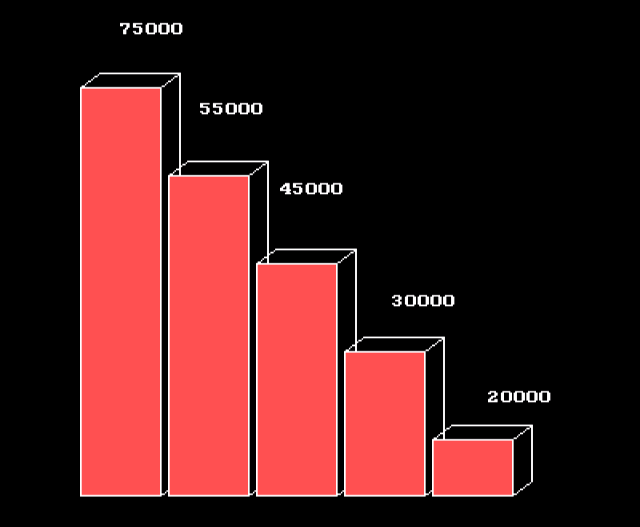
C Program To Display 3D Bar Chart
A bar chart is used to display statistical data. The 3d bar chart is a type of bar chart in which each bar represents a value. The greater the value, the longer the 3d bar in the 3d bar chart. In this article, you will learn to write a program that will draw a 3d bar chart on the screen.
This program is written using Turbo C++ 3 compiler on a windows 7 64-bit computer.
Problem Definition
We want to write a program that will display a 3d bar chart on the screen. Each bar must have a value associated with it. The program to display 3d bar chart goes through the following steps.
- Declare all graphics and non-graphics variables.
- Initialize the variables.
- Initialize the graphics.
- Set the fill style for 3d bars.
- Set values for each 3d bar.
- Draw the 3d bar.
- Close the graph.
Program Code – 3D Bar Chart
/* Program to create a 3d bar-chart in C */

#include <stdio.h>
#include <stdlib.h>
#include <conio.h>
#include <graphics.h>

int main()
{
/* Variable declarations */

int gdriver, gmode,i,j;
int xs,xe, ys, ye, x, y;

/* Variable initialization */
gdriver = DETECT;

/* Graph initialization */
initgraph(&gdriver, &gmode, "d:\\turboc3\\bgi");

/* set the fill style */

setfillstyle(SOLID_FILL,LIGHTRED);

/* Draw the 3d bar chart */
x = 180;
y = 25;
outtextxy(x , y , "75000");
outtextxy(x + 50 , y + 50, "55000");
outtextxy(x + 100 , y + 100 , "45000");
outtextxy(x + 170, y + 170 , "30000");
outtextxy(x + 230, y + 230 , "20000");
j = 55;
xs = 100;xe = 150, ys = 10, ye = 320;
for(i = 0; i<5;i++)
{

xs = xs + j;
ys = ys + j;
xe = xe + j;

bar3d(xs, ys, xe, ye, (xe - xs)/4, 1);
}
getch();

/* close the graph */

closegraph();
return 0;
}
The following code section gives the values to each bar in the graph. The graphics text is displayed on the top of each 3d bar.
outtextxy(x , y , "75000");
outtextxy(x + 50 , y + 50, "55000");
outtextxy(x + 100 , y + 100 , "45000");
outtextxy(x + 170, y + 170 , "30000");
outtextxy(x + 230, y + 230 , "20000");
Output – 3D Bar Chart
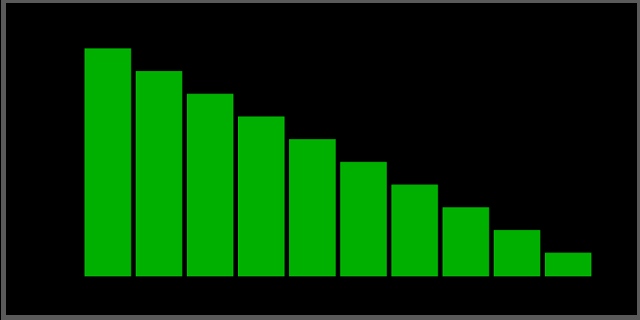
C Program to Draw a Bar Chart
The bar charts used to display statistical data. It is a graphical method to present data and each bar has two dimensions. Usually, one dimension is time. In this article, you will learn to draw a bar chart with the help of C programming graphics support.
Problem Definition
We want to demonstrate the ability of C graphic support to draw bar that can represent data. The bar chart in this example program does not contain any data. However, we might add data in similar examples in future articles.
To draw the graph, the program goes through the following steps:
- Declare all graphics variables.
- Initialize all variables.
- Initialization of the graph and set the path to the BGI interface.
- Set the fill style for the bars.
- Draw the bar chart.
- Close the graph.
Program Code – Bar Chart
/* Program to create bar chart in C */
#include <stdio.h>
#include <graphics.h>
#include <stdlib.h>
#include <conio.h>

int main()
{
/* Variable declaration */

int gdriver, gmode,i,j;
int x_start, y_start, x_end, y_end;

/* variable initialization */

gdriver = DETECT;

/* Graph initialization */

initgraph(&gdriver, &gmode, "d:\\turboc3\\bgi");

/* Loop through the fill style */

x_start = 100;
y_start = 120;
x_end = 140;
y_end = 340;


/* Set fill style */

setfillstyle(SOLID_FILL, GREEN);

/* draw the bar chart */


i = 0;
j = 5;

while(i < 10)
{
x_start = x_start + 40 + j;
x_end = x_end + 40 + j;
y_start = y_start + 20;

bar(x_start, y_start, x_end, y_end);
i++;

}

getch();

/* close the graph */

closegraph();
return 0;

}
Output
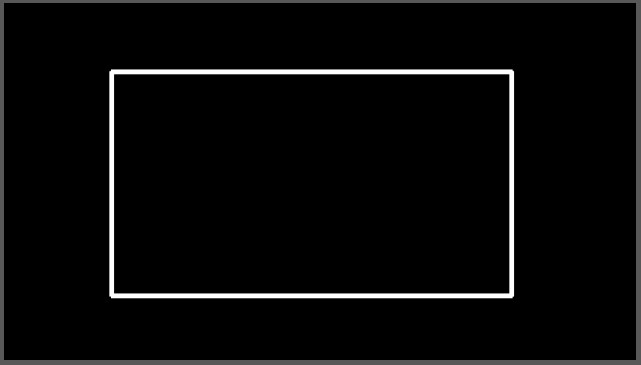
C Program To Draw A Rectangle
The C graphic header file has a builtin function to draw various geometric shapes such as lines, circles, polygons, and quadrilaterals. In this article, you will learn to draw a rectangle using C programming graphics support.
Problem Definition
To draw the rectangle using C graphics support, we write a program that does the following:
- Declare all graphic variables including graphic driver.
- Initialize all graphic variables.
- Initialization of graph and set path to graphic library support in C compiler.
- Set the line style for rectangle.
- Draw the rectangle.
- Close the graph.
Source Code – Draw Rectangle
/* Program to draw a rectangle using C graphic support */
#include <stdio.h>
#include <conio.h>
#include <graphics.h>
#include <stdlib.h>
int main() /* Main function begins */
{
     /* Declare the graphic variables */
     int gdriver, gmode, userpattern;
     int left, right, top, bottom;
     /* Initialize the graphic driver to autodetect the graphic drivers */
     gdriver = DETECT;
     userpattern = 1;
     /* Initialization of graph and path set to graphic interface */
     initgraph(&gdriver, &gmode, "D:\\TURBOC3\\BGI");
     /* Set the line style */
     setlinestyle(SOLID_LINE,userpattern,3);
     /* Draw the line */
     left = 100;
     top = 80;
     bottom = 220;
     right = 350;
     rectangle(left, top, right, bottom);
     /* close the graph */
     getch();
     closegraph();
     return 0;
}
The most important code is setting dimensions of the rectangle which draw the shape.
left = 100;
top = 80;
bottom = 220;
right = 350;
Each variable is a corner point of the rectangle that defines the length and breadth of the sides of the rectangle. The left is 100 px in x-axis direction, top is 80 px in y-axis direction, the bottom is 220 px in x-axis and the right is 350 px in y-axis direction.
The (right – left) is 250px ( longer side) and the (bottom – top) is 120 px (shorter side) of the rectangle.
Output
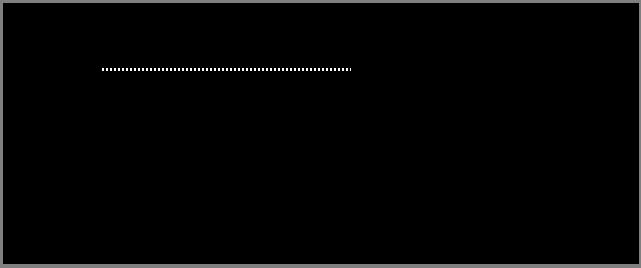
C Program To Draw A Line
The C programming language allows drawing graphic shapes such as lines, rectangle, circles and so on. In this article, you will learn to write a program that draws a line on the console.
This program is written using turbo C++ compiler installed on a windows 7 64-bit PC.
Problem Definition
The program uses the C graphic header files and uses the builtin functions to draw a line on the screen. The important steps in this program are:
- Declare the graphic driver and graphic mode variable.
- Initialize the graphic driver
- Initialize the graph and set the path to the graphic support.
- Draw the line
- Close the graph.
Each of these steps are specific lines of codes in the program.
Source Code – C Line Drawing
/* Program to draw a line using C graphic support */
#include <stdio.h>
#include <conio.h>
#include <graphics.h>
#include <stdlib.h>
int main() /* Main function begins */
{
     /* Declare the graphic variables */
     int gdriver, gmode, userpattern;
     int x, y, x_max, y_max;
     /* Initialize the graphics driver to autodetect the graphics drivers */
     gdriver = DETECT;
     userpattern = 1;
     /* Initialization of graph and path set to graphics interface */
     initgraph(&gdriver, &gmode, "D:\\TURBOC3\\BGI");
     /* Set the line style */
     setlinestyle(DOTTED_LINE,userpattern, 3);
     /* Draw the line */
     x = 100;
     y = 70;
     x_max = 350;
     y_max = 70;
     line(x, y, x_max, y_max);
     /* close the graph */
     getch();
     closegraph();
     return 0;
}
Output
C Program for Arithmetic Expressions using Macros
C macros are preprocessor directives like #define that is directly replaced into a source code in a C program. This replacement mechanism is called macro expansion.
In this example program, we will use a #define directive to do arithmetic operations.
Learn about C macro expansion before you begin with the example.
Problem Definition
As we mentioned earlier, #define directive is used to do macro expansion. In this program, we will write four function like macros that take two arguments and perform the arithmetic operations similar to a calculator.
For example, if X and Y are two arguments then
#define ADD(X, Y) ( X + Y)
#define SUBTRACT( X, Y) ( X - Y)
#define MULTIPLY(X, Y) (X * Y)
#define DIVIDE(X, Y) (X/Y)
Any variable that replaces X and Y will be used for arithmetic operations directly within the macros. Each opeation is separate and does not affect each other unless any expression changes the value of X or Y or both.
The source code of the program is given in the next section.
Program Source Code
#include <stdio.h>
#include <stdlib.h>
#define ADD(X, Y) ( X + Y)
#define SUBTRACT(X, Y) (X - Y)
#define MULTIPLY(X, Y) (X * Y)
#define DIVIDE(X, Y) (X/Y)
int main(){

int a,b;

 /* variable declaration and initialization */
int addition,subtraction,mul,division;
addition = subtraction = mul = division = 0;

/* Reading Input values */
printf("Enter two numbers:\n");
scanf("%d",&a);
scanf("%d",&b);

/* Compute */
addition = ADD(a, b);
subtraction = SUBTRACT(a, b);
mul = MULTIPLY(a, b);
division = DIVIDE(a, b);

/* printing outputs */printf("\n");
printf("_________________________\n");
printf("Addition = %d\n",addition);
printf("Subtraction = %d\n",subtraction);
printf("Multiplication = %d\n",mul);
printf("Division = %d\n",division);
getch();system("PAUSE");
return 0;
}
Output
When the program executes, it asks for two input numbers – X and Y values. Once you enter the numbers, the preprocessor replaces the macros with actual codes and inputs are used to compute results.
The following screenshot shows the result obtained for inputs: X = 32 and Y = 2.
___________________________________
Enter two numbers:
34 2
___________________________________
Addition = 36
Subtraction = 32
Multiplication = 68
Division = 17
Related Articles:
Program To Compute Standard Deviation For Non-Grouped Data
In this example program, we compute the standard deviation for input non-grouped data and output the result.
The standard deviation is a measure to understand how much data deviates from the mean value. The data may be grouped or non-grouped where non-group data is a list of data.
In the next section, we will discuss the problem in detail.
Problem Definition
The standard deviation is a measure useful in comparing two sets of data when their mean value is the same. To calculate the standard deviation we use the following formula in this example program.
\Large SD = \sqrt{\frac{(x - \overline{x})^2}{n}}Where \Large \overline{x} is the mean value.
Given the formula, you can find standard deviation in the following steps.
- Find the mean value.
- Take the sum of each data element \Large x , subtracted from mean and then squared.
- Take the square root of \frac{\Large sum}{\Large n}where \Large n
<mark style="background-color:rgba(0, 0, 0, 0);color:#bb1717" class="has-inline-color"></mark>is the number of data elements.
The first step is to find the mean value of the given non-grouped data. The program takes the sum of all data elements and divides it with the total number of elements.
\Large Mean\hspace{1mm} value = \frac{Sum \hspace{1mm}of\hspace{1mm} all \hspace{1mm}elements}{Number\hspace{1mm} of \hspace{1mm}elements}The second step in process of finding standard deviation is to take the sum of each data element (say x ) and subtract it from the mean and then square it.
\Large Sum = Sum + (x[i] - mean \hspace{1mm}value)^2Where \Large x[i] represents a data element from the list of non-grouped data set. The last step is to compute the standard deviation using the following.
\Large Standard \hspace{1mm} deviation = sqrt( Sum / n)where \Large n is the total number of elements in data set and Sum is the value found in the previous step.
Program Codes – Standard Deviation for Non-grouped Data
#include <stdio.h>
#include <math.h>

/* Function Declaration */
float standard_deviation(float data[], int n);

int main()
{
    int n, i;
    float data[100];

    printf("Enter number of data elements (1 to 100): ");
    scanf("%d", &n);

    if (n <= 0 || n > 100)
    {
        printf("Invalid number of elements\n");
        return 0;
    }

    printf("Enter elements:\n");
    for (i = 0; i < n; i++)
        scanf("%f", &data[i]);

    printf("Standard Deviation = %.3f\n",
           standard_deviation(data, n));

    return 0;
}

float standard_deviation(float data[], int n)
{
    float mean = 0.0, sum = 0.0;
    int i;

    for (i = 0; i < n; i++)
        mean += data[i];

    mean /= n;

    for (i = 0; i < n; i++)
        sum += (data[i] - mean) * (data[i] - mean);

    return sqrt(sum / n);   /* Ungrouped data SD */
}
#include <iostream>
#include <cmath>
using namespace std;

float standardDeviation(float data[], int n)
{
    float mean = 0, sum = 0;

    for (int i = 0; i < n; i++)
        mean += data[i];
    mean /= n;

    for (int i = 0; i < n; i++)
        sum += (data[i] - mean) * (data[i] - mean);

    return sqrt(sum / n);
}

int main()
{
    int n;
    float data[100];

    cout << "Enter number of elements (1 to 100): ";
    cin >> n;

    if (n <= 0 || n > 100)
    {
        cout << "Invalid input\n";
        return 0;
    }

    cout << "Enter elements:\n";
    for (int i = 0; i < n; i++)
        cin >> data[i];

    cout << "Standard Deviation = "
         << standardDeviation(data, n) << endl;

    return 0;
}
import java.util.Scanner;
class StandardDeviation
{
static double standardDeviation(double data[], int n)
{
double mean = 0, sum = 0;
for (int i = 0; i < n; i++)
mean += data[i];
mean /= n;
for (int i = 0; i < n; i++)
sum += (data[i] - mean) * (data[i] - mean);
return Math.sqrt(sum / n); // Population SD
}
public static void main(String args[])
{
Scanner sc = new Scanner(System.in);
int n;
double[] data = new double[100];
System.out.print("Enter number of elements (1 to 100): ");
n = sc.nextInt();
if (n <= 0 || n > 100)
{
System.out.println("Invalid input");
return;
}
System.out.println("Enter elements:");
for (int i = 0; i < n; i++)
data[i] = sc.nextDouble();
System.out.println("Standard Deviation = "
+ standardDeviation(data, n));
sc.close();
}
}import math
n = int(input("Enter number of elements (1 to 100): "))
if n <= 0 or n > 100:
print("Invalid input")
exit()
data = []
print("Enter elements:")
for _ in range(n):
data.append(float(input()))
mean = sum(data) / n
variance = sum((x - mean) ** 2 for x in data) / n
std_dev = math.sqrt(variance)
print("Standard Deviation =", round(std_dev, 3))Output – Compute Standard Deviation for non-grouped data
When we execute the program whose code is given above. It asks for the number of data elements which should be less than \Large 100. For the purpose of example, you can enter any number (say \Large 7).
The program then asks for data elements, we entered following – \Large 56, 45, 89, 78, 12, 23, 35. The standard deviation value is \Large 26.031. To prove the correctness of the output, we leave it as an exercise for you. The output is shown below.
Enter Number of Data elements( Less than 100):7
Enter Elements:
56
45
78
89
23
12
35

Standard Deviation - 26.031Program To Find Average Age
This program finds the average age of a person using an array. The array which stores a list of age is passed on to a function and the function computes the average age and returns a value.
Problem Definition
To find the average age of person the program does the following tasks.
- Read all the values in an array.
- Pass the entire array to function average( ).
- Function average() computes and returns a value.
First, we store all the values of age in the array during array declaration. Do not mention the size during array declaration because it is automatically determined when array members are assigned.
For example
int arr[] = {20, 34, 45, 26, 58, 33};The above declaration has 6 members; therefore, the size of the array is 6. Second, the array is passed on the function when you call the function in the main program.
main()
{
      avg = average(arr);
}
The value returned by function average will be assigned to variable avg. When the array is passed on to the function, only the reference to the first member of the array is passed. Other members are located using the reference to the first member.
Program Source Codes
#include <stdio.h>
#include <stdlib.h>
int average(int arr[]); /* Function declaration */
int main()
{
     int avg;
     int arr[] = {20, 34, 45, 26, 58, 33}; /* Array of ages */
     avg = average(arr); /* calling function average */
     printf("Average Age = %d\n",avg);
     system("PAUSE");
     return 0;
}

/* Function Definition - Average() */
int average(int a[])
{
     int i;
     int avg, sum=0; /* local variables */
     for(i=0;i<6;i++)
     {
       sum = sum + a[i];
     }
     avg = (sum/6);
     return avg;
}
#include <iostream>
using namespace std;
/* Function declaration */
int average(int arr[]);
int main() {
int avg;
int arr[] = {20, 34, 45, 26, 58, 33}; /* Array of ages */
avg = average(arr); /* calling function */
cout << "Average Age = " << avg << endl;
return 0;
}
/* Function Definition - average() */
int average(int a[]) {
int sum = 0;
for (int i = 0; i < 6; i++) {
sum += a[i];
}
return sum / 6;
}public class AverageAge {
/* Function to calculate average */
static int average(int[] a) {
int sum = 0;
for (int i = 0; i < 6; i++) {
sum += a[i];
}
return sum / 6;
}
public static void main(String[] args) {
int avg;
int[] arr = {20, 34, 45, 26, 58, 33}; /* Array of ages */
avg = average(arr); /* calling function */
System.out.println("Average Age = " + avg);
}
}# Function to calculate average
def average(a):
sum = 0
for i in range(6):
sum += a[i]
return sum // 6
# Main program
arr = [20, 34, 45, 26, 58, 33] # Array of ages
avg = average(arr)
print("Average Age =", avg)Output
The output of the above program is given below. The average age is 36 because:
\begin{aligned} &20 + 34 + 45 + 26 + 58 + 33 \\
&= \frac{216}{6}\\
&= 36
\end{aligned}
Therefore, the program works fine.
Average Age = 36
Press any key to continue . . .